User Guide
Overview
vmblu is a collection of tools, formats and prompts designed to build, understand and maintain software created with coding agents.
It serves two roles simultaneously:
- guiding the coding agent while constructing the system
- enabling the human to understand, verify and control what has been built
The vmblu toolkit can be roughly divided into:
- Schemas — formal descriptions of the architecture and the data exchanged between application components.
- Prompts — structured instructions that define how the coding agent designs and builds the system, including the roles it assumes during development.
- Commands — mechanical utilities such as project initialization, application generation, test harness creation and source profiling.
- Graphical Editor — an interactive representation of the architecture as interconnected nodes, allowing navigation, inspection and modification.
- Runtime — a message-switching layer between components, supporting inspection, attribution and reporting of runtime behaviour.
- Agent integration - exposes selected capabilities of the system to agents through capability manifests, MCP projections and the vmblu runtime.
The toolkit — or scaffold — supports development, but ultimately produces a normal deployable application that can run in a browser, on a server or elsewhere.
Vibe coding is great fun, but vmblu targets applications that are complex and long-lived. Applications you must still understand, extend and verify six months from now.
Central to vmblu is explicit architecture:
- What are the building blocks?
- How are they interconnected?
- What data do they exchange?
- What is allowed — and what is not?
The coding agent is prompted to design this architecture before writing code. Architecture is not where agents naturally excel, so vmblu makes it explicit, inspectable and continuously aligned with the implementation. The architecture is not documentation — it is the system.
An important component of vmblu is the graphical editor. It provides an immediate overview of the system structure and allows interactive modification: adding nodes, connecting or disconnecting components, inspecting data formats, navigating source code and editing runtime settings. Although a large part of this user guide focuses on the editor, it is straightforward to use.
vmblu is open source. All formats, prompts and tools are available for inspection and modification.
The vmblu framework
The following paragraphs give an overview of the project layout, commands and agent integration files that are used by vmblu. For installation details see the installation guide.
Users will normally let an agent install the files it needs to work with vmblu and then simply instruct the agent to 'use vmblu', but the paragraphs below give some background information about which files, schemas and commands an agent uses when it uses the vmblu skill.
Installing vmblu support for an agent
vmblu is coding-agent agnostic. The CLI, runtime and model formats are the core product; Codex, Claude and other agents are integration layers over that core.
For Codex users, the preferred route is the vmblu Codex plugin when it is available. The plugin packages the vmblu skill together with metadata, icons, starter prompts and a place for future Codex-specific features. The lightweight fallback is the generic agent installer:
vmblu agent install codexFor Claude, use the Claude-specific installer:
vmblu agent install claudeYou can inspect available agent integrations with:
vmblu agent listAfter installing agent support, you can usually start an agent session with a short instruction such as:
use vmbluThe agent should then read the project-local vmblu prompt before changing the project.
Resources an agent uses
When working with vmblu an agent has several resources available:
SKILL.md
General agent workflow for vmblu projects. It tells the agent how to behave: detect/init project, read .vmblu/vmblu.prompt.md, find the root *.blu entrypoint, resolve the model, read schema context before model edits, preserve generated artifacts, report what was used. The file is installed in your agent's skill folder.
cli/context/x.y.z/*
Canonical vmblu format/reference material for a given schema version. This explains the shape and semantics of *.mod.blu, *.mod.viz, *.src.prf, *.cap.json, annex rules, pin prompts, etc. This information is versioned and part of the cli distribution.
.vmblu/vmblu.prompt.md
Project-local vmblu guidance. It should mainly tell the agent how this project should be handled locally: entrypoint name, model layout, generated-file policy, local overrides, non-standard paths, pinned versions, special constraints, and any intentional deviations from the generic SKILL.md or canonical schema/context workflow.
Project content prompts/specs
The actual product/application intent: what the system should do, domain behavior, UX, runtime expectations, feature requirements, acceptance criteria. These may be files like application-prompt.md, spec.md, or user-provided prompt files. This is your work. Keep in mind that the authorative document for the project is the model file, that also stores prompts for nodes.
All a user has to do to make an agent aware of these resources and to use them on a project is to inform the agent to 'use vmblu'.
Using the vmblu init command
When a coding agent or developer starts a new vmblu application, the first command is normally:
vmblu init <project-name>This creates the current default layout:
<project-name>/
  <project-name>.blu
  package.json
  model/
    <project-name>.mod.blu
    <project-name>.mod.viz
  nodes/
  .vmblu/
    vmblu.prompt.md
    overrides/
    cache/
    logs/
The root entrypoint
The root <project-name>.blu file is a small entrypoint manifest:
{
  "kind": "vmblu.entrypoint",
  "version": 1,
  "model": "model/<project-name>.mod.blu"
}
Open this file in the editor or pass it to CLI commands. The CLI resolves it to the real model file in model/.
The model/ folder
The model/ folder contains the application model file set:
<project-name>.mod.blu: the architecture model and source of truth for nodes, connections, contracts, data types, runtime choice and agent-facing capabilities.<project-name>.mod.viz: visual layout for the editor. It can be regenerated or changed by arranging the model in the editor.<project-name>.src.prf: generated source profile with handler, transmit and type information found in source files.<project-name>.app.js: generated application file created byvmblu make-app.<project-name>.cap.json: generated capability manifest created byvmblu make-capabilities.
The model can be spread over several files, but these files still belong to one logical model. Derived artifacts are kept next to the model so they can be included in an application distribution when needed.
The .vmblu/ folder
.vmblu/ is no longer the place for the main model or general copied docs. It is for project-local vmblu metadata:
vmblu.prompt.md: short project-facing instructions for coding agents.overrides/: optional project-local overrides.cache/: local generated cache.logs/: local generated logs.llm-bridge/: optional local bridge configuration for browser development.
General schemas and docs are resolved from the installed vmblu packages. They are not copied into every project by default.
The nodes/ folder
This is where source code owned by the model is located. Simple nodes often fit in a single file; complex nodes or UI components may use their own directory. The node name is normally reflected in the file or directory name. You can deviate from this convention when the project requires it, but keeping code allocated to nodes makes the architecture easier to inspect and maintain.
One thing to watch out for when working with coding agents is that all code they write should be clearly allocated to nodes unless you deliberately ask for a shared library.
The test/ folder
An agent taking on a tester role can create a test setup with:
vmblu make-test <project-name>.bluThe test setup contains a test model where source nodes are paired with mirror nodes. A mirror node has an output for each input of the original node and an input for each output. The coding agent then writes the mirror-node code needed to test the original nodes.
Commands
The vmblu CLI commands are used by coding agents, the editor and developers to create or refresh project artifacts.
vmblu init <folder-name>
Creates a new vmblu project layout. It creates files and folders; it does not overwrite existing files unless --force is used.
Useful flags:
--name <project>: project name, defaulting to the folder name.--schema <ver>: schema version, defaulting to the package version.--force: overwrite existing files.--dry-run: show actions without writing files.
vmblu make-app <model-or-entrypoint>
Creates the executable app from the model. The input can be the root <project-name>.blu entrypoint or a direct .mod.blu path.
By convention the generated file is:
model/<project-name>.app.jsvmblu make-capabilities <model-or-entrypoint>
Creates the vmblu capability manifest for agent/tool integration. The capability manifest is vmblu-native; MCP or provider-specific tool definitions are projections from it.
By convention the generated file is:
model/<project-name>.cap.jsonvmblu make-test <model-or-entrypoint>
Sets up the test structure for the project. It creates the test model and the mirror-node structure used to test source nodes.
vmblu profile <model-or-entrypoint>
Scans source files and writes the source profile used by the editor and agent. The profile helps locate handlers, transmissions and parameter types in source code.
Useful flags:
--out <file>: output file.--full: check all source files in the model.--changed <files...>: only check changed files.--deleted <files...>: remove data for deleted files.--delta-file <path>: write the delta to a file.--reason <text>: reason for the profiling run.
Work flow
To start a new project, install the relevant vmblu agent support and tell your coding agent that the project should use vmblu. With Codex this can be the vmblu plugin or the lightweight skill installer; with Claude it is the Claude agent support installed through the CLI.
A minimal first prompt can be as short as:
use vmbluFor a new application, give the agent a little more context:
We are making a simple chat application.
It consists of two sub-projects: a chat server and a chat client.

In `./examples/chat-application`, initialize the projects:

- `vmblu init chat-client`
- `vmblu init chat-server`

Use the vmblu workflow for both projects.
Before making project changes, read each project's `.vmblu/vmblu.prompt.md`.
Use each root `.blu` entrypoint to find the model file in `model/`.

First design the architecture in the model files and ask for approval.
After the architecture is approved, write the node code in `nodes/`.
Then generate the app and, if requested, the test model.

Description of the application:

[Describe the application, target runtime, UI framework, server framework,
important constraints and expected behaviour.]
The important part is not the exact wording. The important part is that the agent works in this order:
- Initialize or detect the vmblu project.
- Read
.vmblu/vmblu.prompt.md. - Use the root
.bluentrypoint to find the model inmodel/. - Design or update the architecture before writing code.
- Keep node-owned source code in
nodes/. - Generate derived artifacts such as app, profile, test model and capabilities with the vmblu CLI.
- Run the project and report what was verified.
For larger applications it is useful to ask the agent to stop after the first architecture proposal. The graphical editor then allows the human to inspect the node split, interfaces, data contracts and routes before code is written.
Coding agents are often competent at implementation but uneven at architecture. vmblu helps by forcing the architecture into a concrete model that can be reviewed, changed and kept aligned with the code. Much of the design process is a back-and-forth with the agent: improve the architecture, add or split nodes, adjust interfaces, then let the agent implement the approved model.
The coding agent can also be asked to take a tester role. In that case it can run vmblu make-test, write mirror-node code and use the test output to improve the original nodes. This is explained in the testing section.
Nodes have runtime settings that can be used for logging, worker placement, safety reporting and agent runtime behaviour. More about this appears in the runtime and agent integration sections.
Editor Core Concepts
Nodes
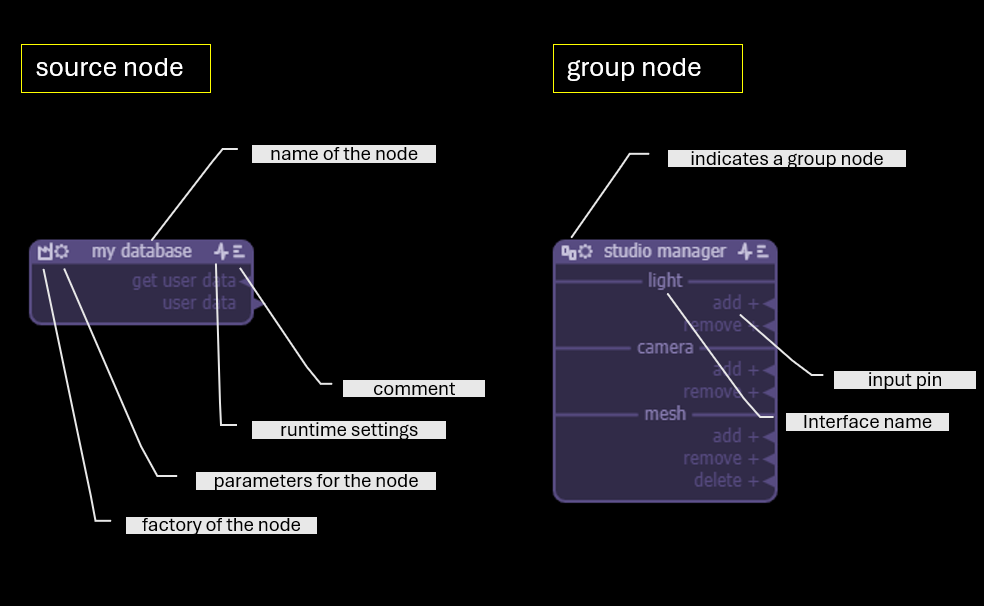
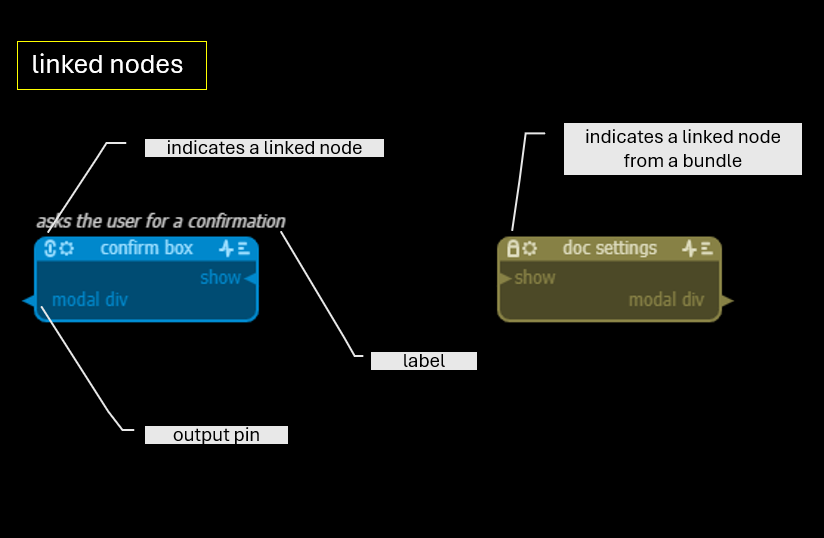
There are three types of nodes in vmblu. They can be recognized by the leftmost icon in the header of the node.
- Source node — implemented in code - factory icon
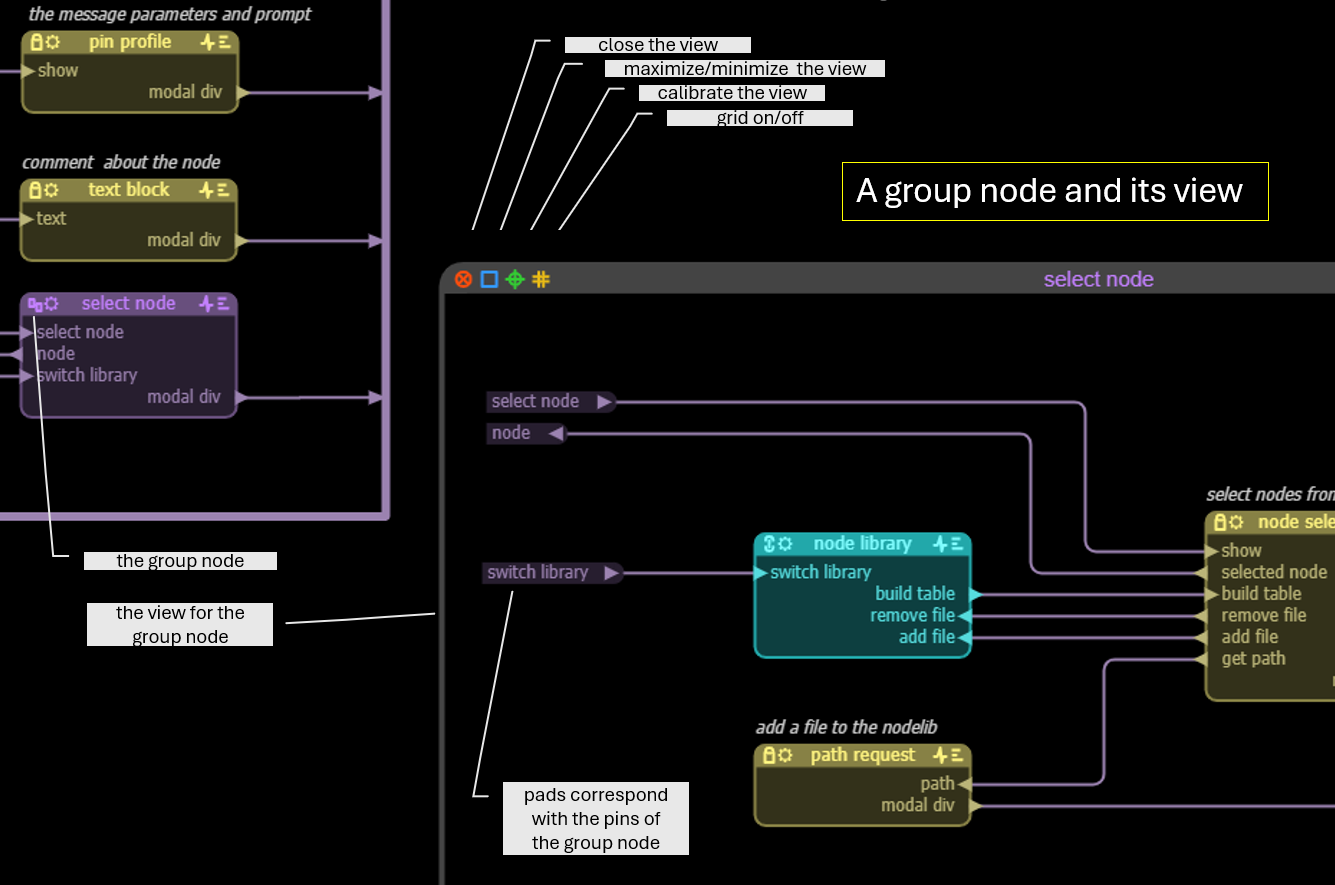
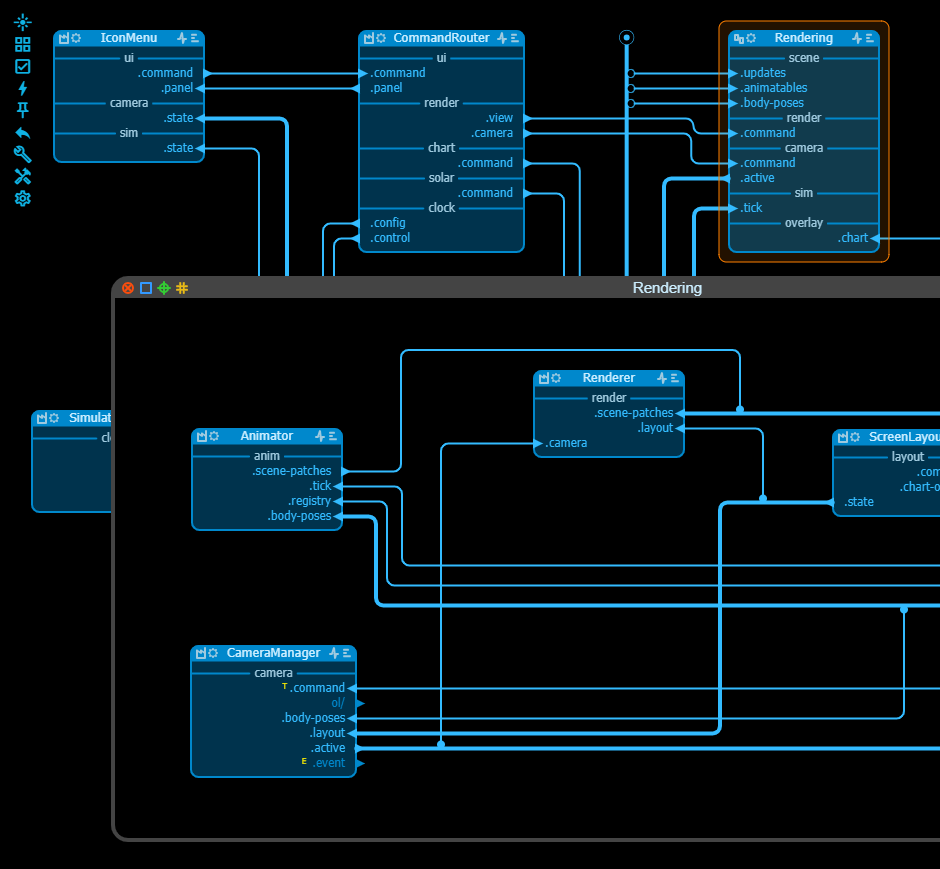
- Group node — contains a sub-model, behaves as one node externally - group icon
- Linked node — imported from another model file - link icon - or a bundle - padlock icon
Click on the...
- factory icon to see or set the location of the generator function for the node
- group icon to open the view with the internal layout of the group node
- link icon to see or set the location of the node linked to
- padlock icon to see the location of the node linked to
Linked nodes can only be changed in the model they are defined in. The name of the node and the position of the pins, eg for better routing, can however be changed also in the importing model.
The three other icons in the node header are common for all nodes:
- settings icon: the optional settings can contain a json structure that is passed to the node when it is instantiated and that contains initialisation data for the node. A linked node initially inherits the settings from the original node, but the values can be changed per node. Any changes made to the format of the settings in the original node are propagated to the linked nodes.
- pulse icon: the pulse icon contains data in json format that is passed to the vmblu runtime but not to the node. These
dxsettings are organized as runtime-facing sections such asrun,monitorandsecurity.runcontrols how and where the node runs,monitorcontrols runtime logging and timing information, andsecuritycontains optional node-level security requests. The format is determined by the selected runtime, and node-level security requests are always checked against the model-level runtime policy. - text icon: the text icon allows to open a field to enter a longer format comment about the node - it can be used as the initial prompt for an LLM to write the code for the node.
Pins & Interfaces
A node has pins and these pins are usually organised in interfaces.
Input / Output pins
- Input - an input pin of a source node maps to a handler of the node: pin do this maps to onDoThis()
- Output - a node can send a message over an output pin using the transmit function
A pin name of a given type (input or output) must be unique for a node. By design pin names are case insensitive, ie pin names Get File or get file or gET fiLe are considered the same. Note that, as explained below, the interface name is often part of the complete pin name.
Data is sent over a pin using the send function - where tx comes from is explained below :
tx.send("pin name", payload);Pin name or message are used interchangeably in the descriptions below.
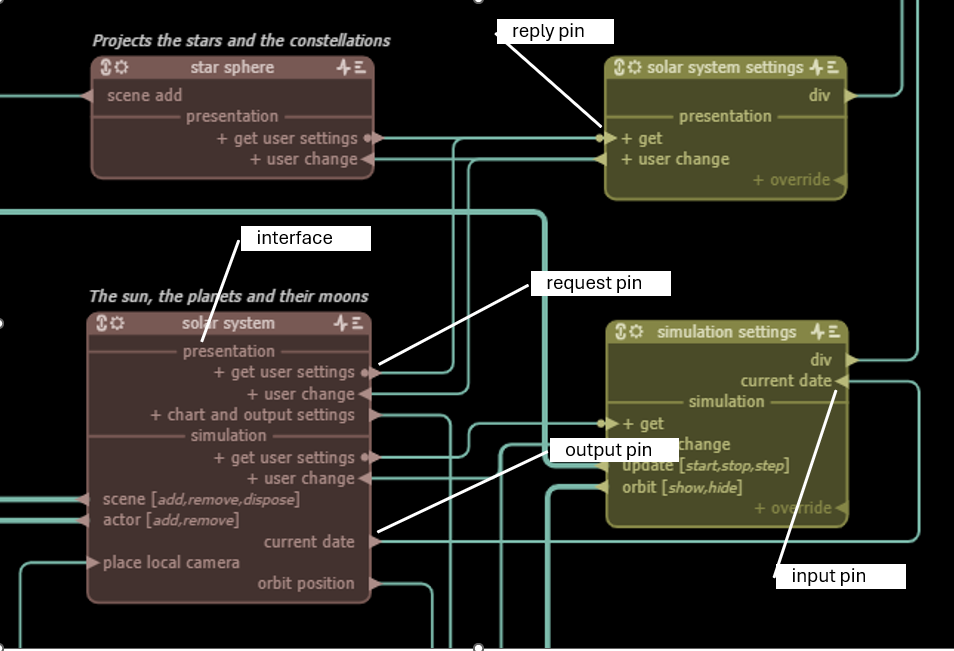
Interfaces
Interfaces are named sections grouping pins. If a pin name starts or ends with one of the following characters : . - _ +, then the interface name is added before/after the pin name, except on the node diagram because the interface name is shown above it anyhow. But in the code the messages will be sent over the pin using the full name: tx.send('if-name.rest-of-pin-name', payload).
The + sign stands for a single space that will be added between the interface name and the pin name. As an example: interface name file combines with messages .get, read- and +save as to file.get, read-file and file save as respectively.
Pins and interfaces can be moved left or right, up or down, to improve routing between nodes.
Request / Reply pins
Request/Reply pins are an output/input pair with back-channel. A node can do a simple reply over the back channel to the node that issued the request. Can be recognized by the small circle at the arrow's base.
In javascript the request/reply mechanism uses promises syntax:
tx.request("pin name", requestPayload, optionalTimeout)
.then((replyPayload) => {})
.catch((error) => {
/* errors:
- message: 'Reply timeout' options: {sender, msec}
- message: 'No channel'
*/
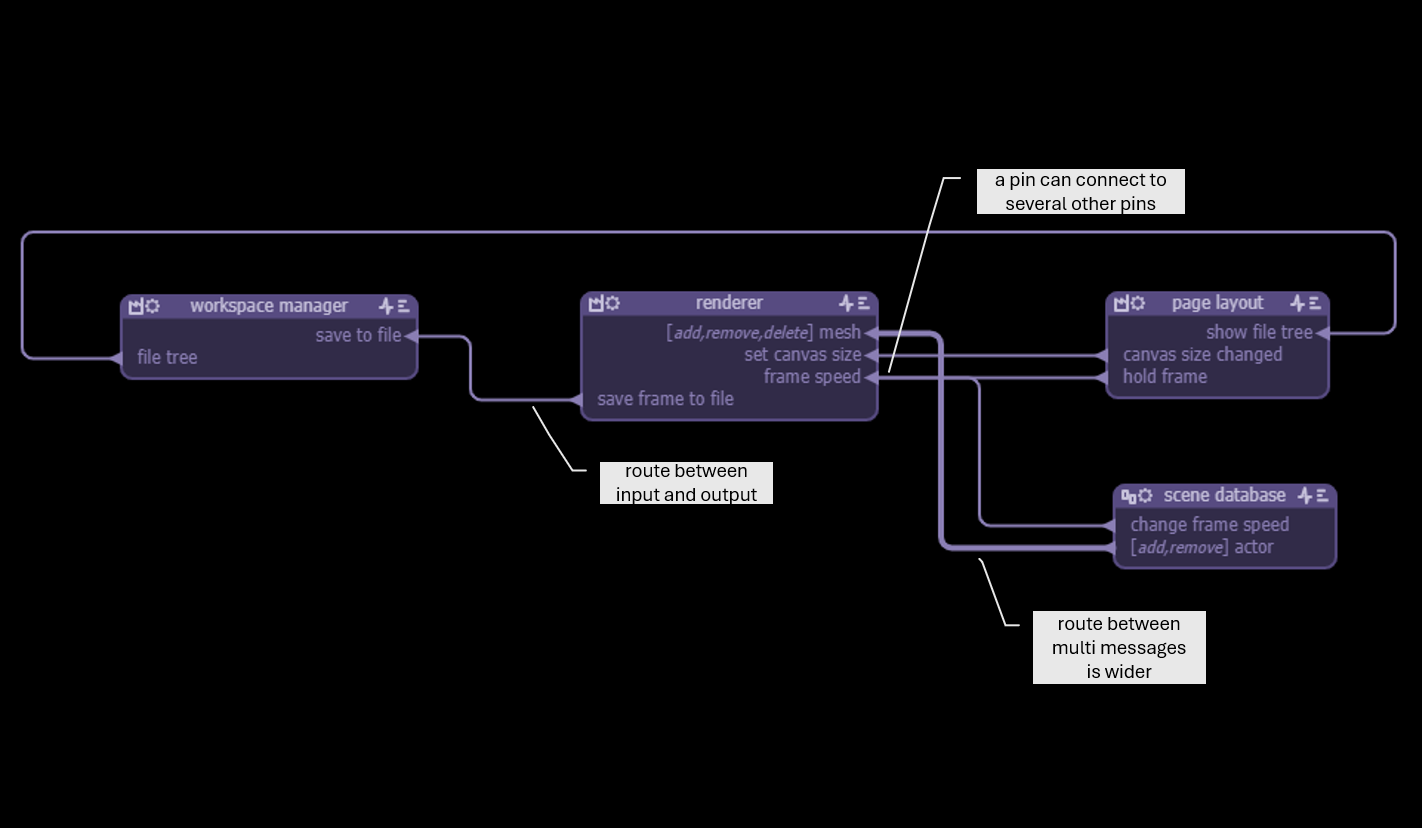
});Routes
Routes connect pins and follow a rectangualar - manhattan - style of interconnection for clarity.
An output pin can be connected to any input pin, names or parameters do not have to match, but impossible connections (eg input to input) are not allowed.
Requests are normally connected to replies, but can be connected to regular inputs, eg for tracking purposes.
Left click on a pin to start a route, shift left click anywhere on a route to undo the route up to that point. The nearest pin will be disconnected.
Routes can be reshaped by clicking on and moving segments.
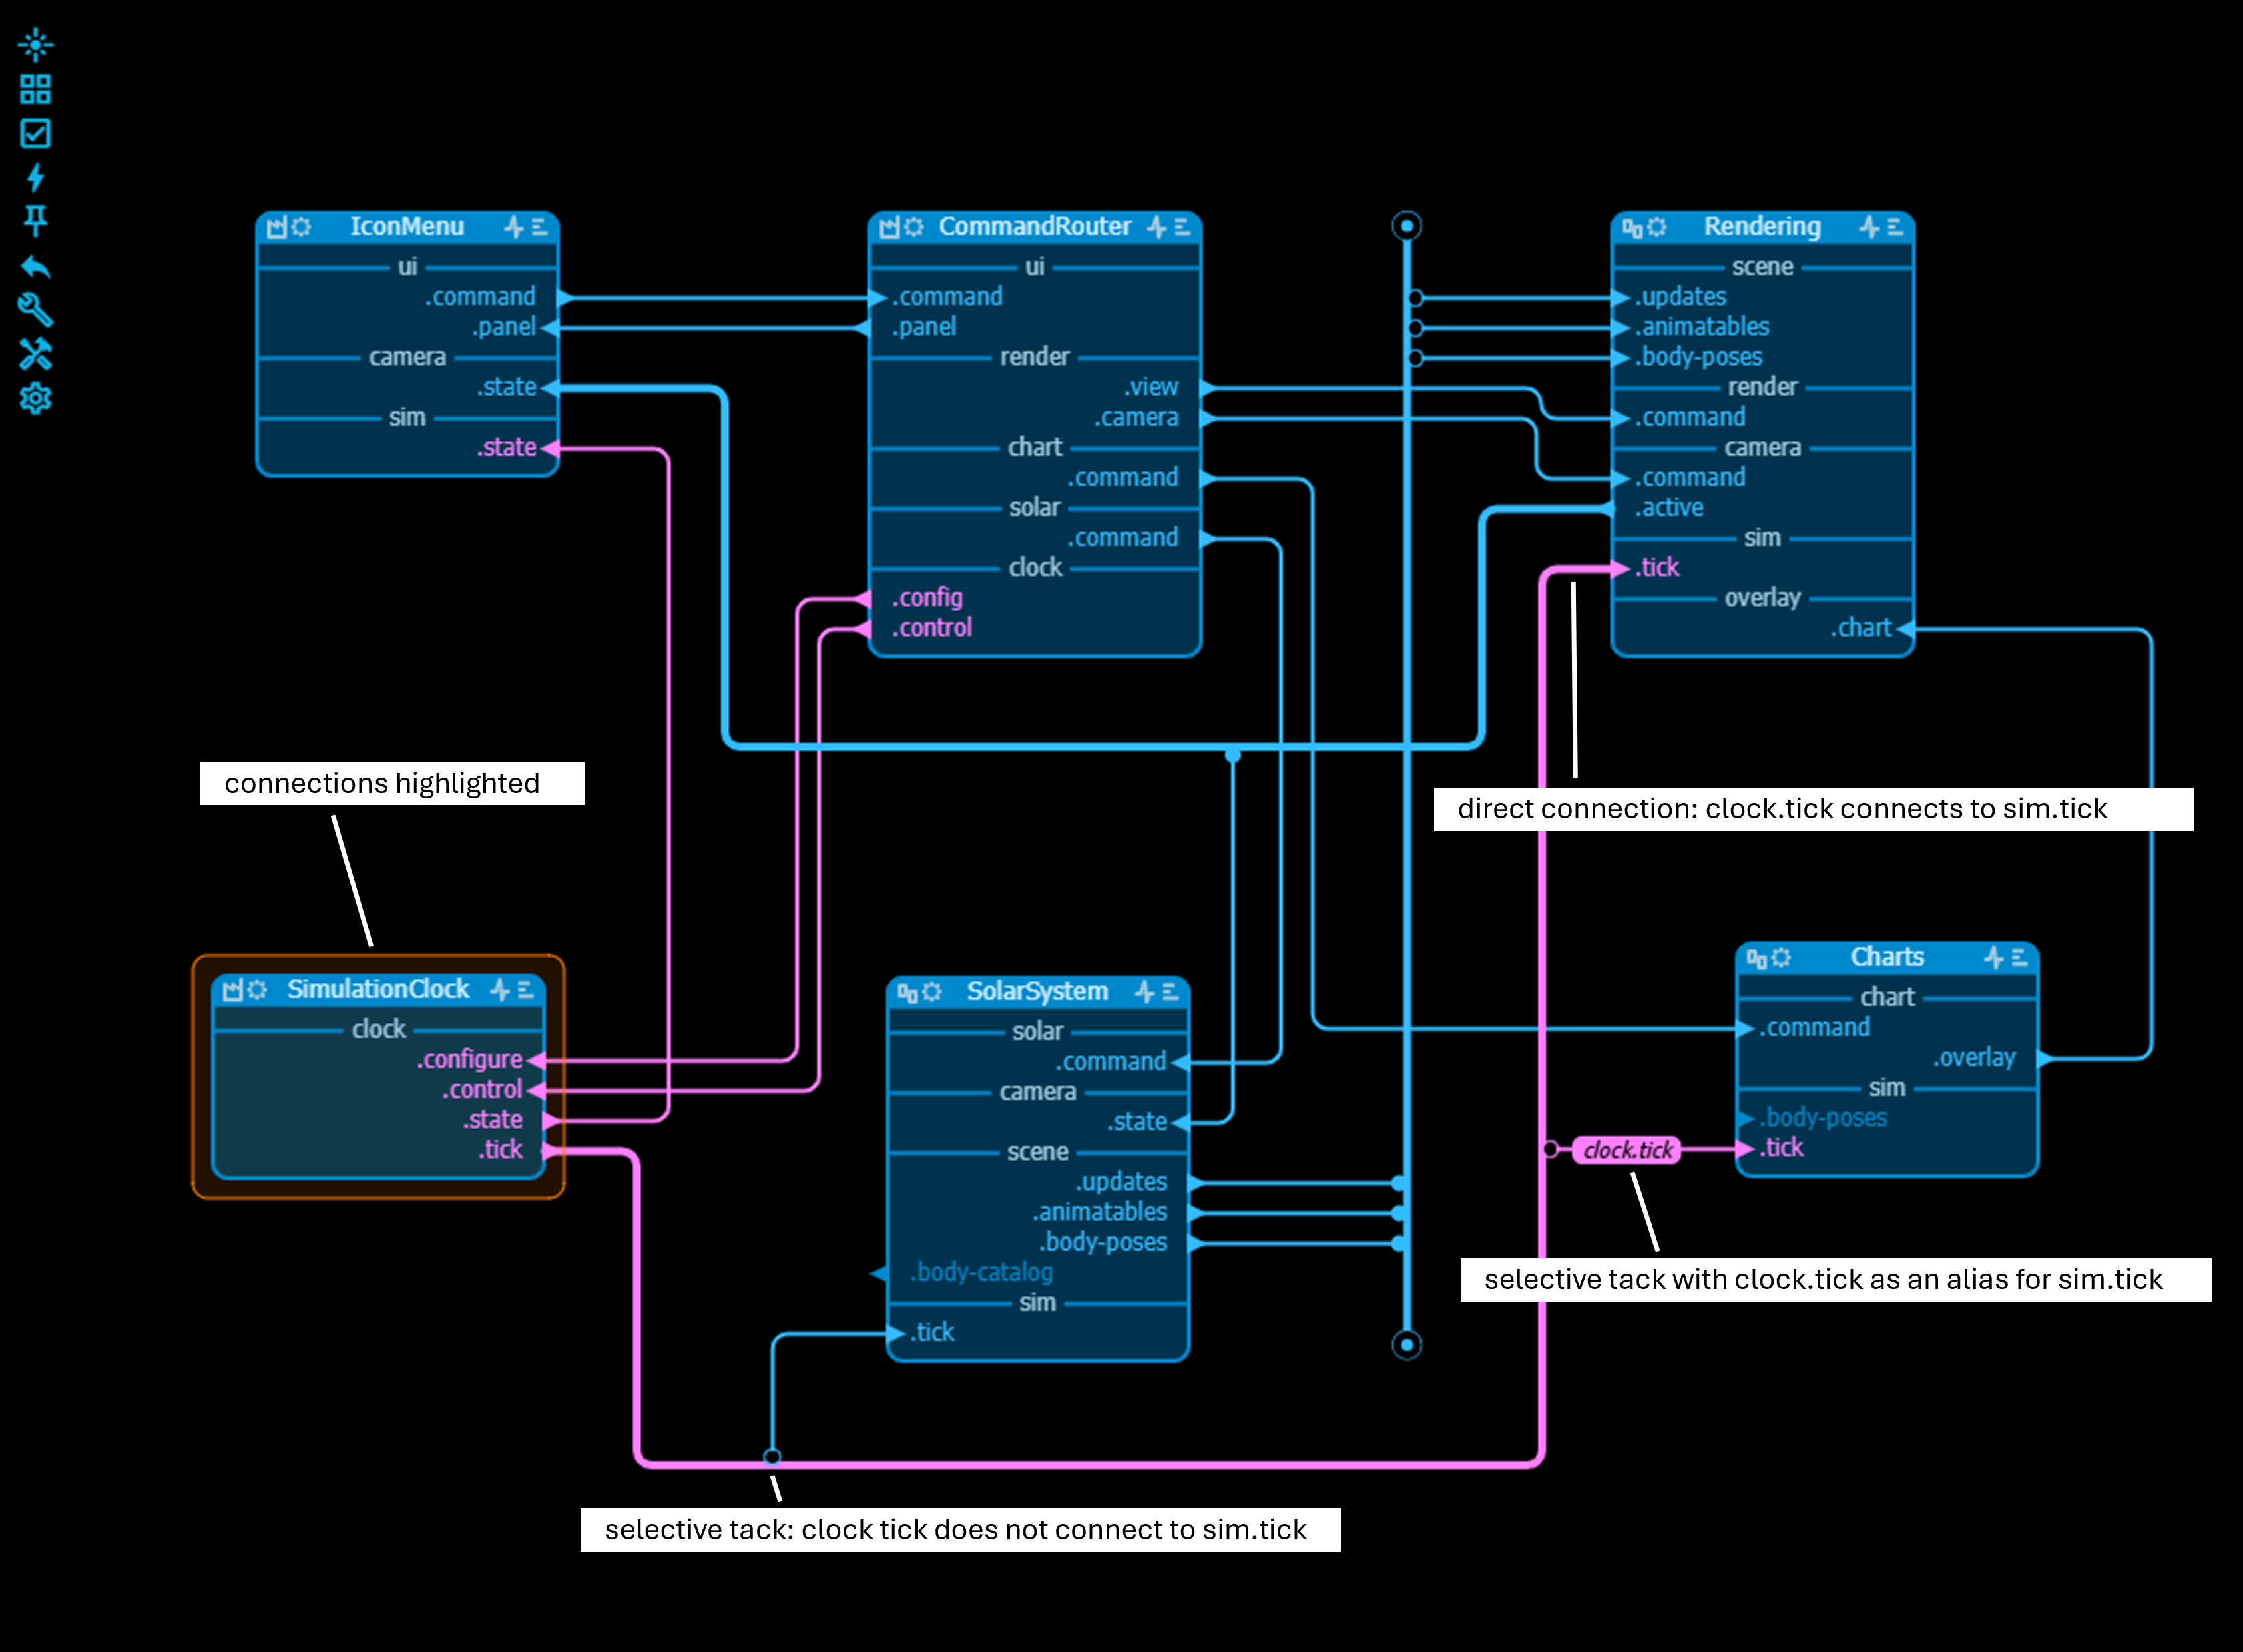
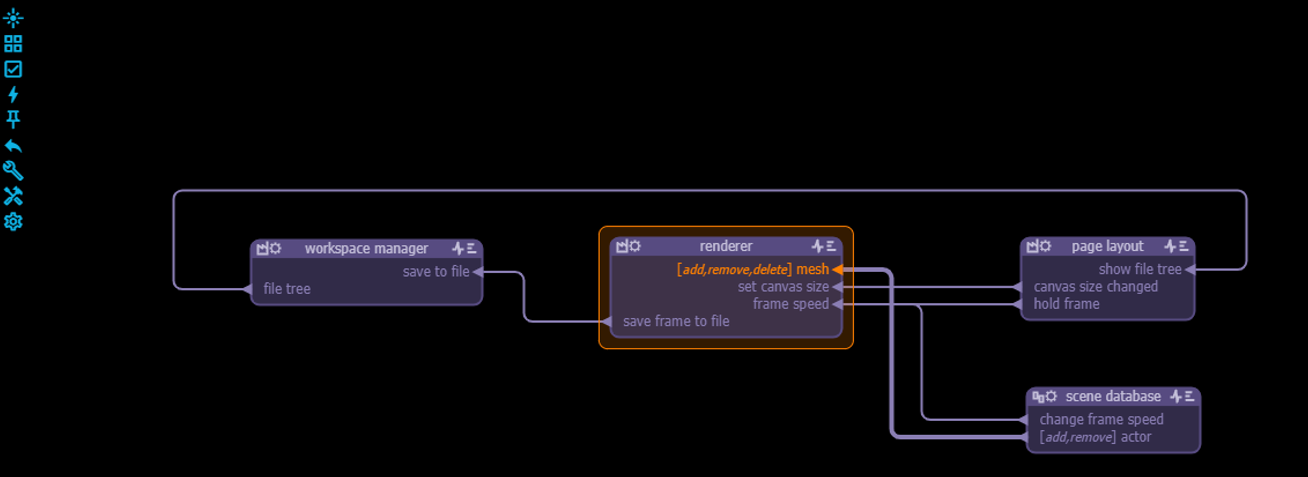
Clicking on pins and interfaces highlights all the connections for that pin or interface. Also all the connections for a single node can be highlighted (ctrl h)
Use wire check from the main menu after manual route cleanup to compare the drawing with the connections stored in the current save point. Missing connections are shown as green routes and extra or wrong routes are shown in red. Click accept changes when the proposed changes are correct.
Cables
To simplify routing between pins, cables can be used. A cable is a shared routing trunk that pins, pads and other cables can connect to through cable tacks.
There are two cable topologies:
- Floating cable - a cable with two free handles. Pins and pads connect to it through cable tacks, and the cable remains free in the drawing.
- Fixed cable - a cable whose two ends are attached to pins or pads. It is useful when the cable itself should form a drawn connection between two endpoints.
Create a floating cable via the context menu or use ctrl b. A fixed cable can be created from the context menu or by converting/rerouting an existing route where supported. When a route can terminate on a cable, the cable will light up while drawing the route. Releasing the left mouse button connects the route to the cable via a cable tack.
Cable tacks control how messages pass through a cable:
- Selective tacks only connect to matching pin names, or to the explicit alias on the tack.
- Non-selective tacks connect without name matching, subject to the normal input/output rules.
When an input pin is connected to a floating cable, its tack is selective by default. When an output pin is connected to a floating cable, its tack is always non-selective, selectivity only makes sense for input tacks. Tacks on fixed cables are non-selective by default. An input tack can be switched between selective and non-selective from the tack context menu.
Floating and fixed cables can be connected to each other. The connection is represented by bridge tacks. Connectivity and highlighting cross the bridge when the tack selectivity rules allow it.
By design, inputs/outputs of the same node cannot be connected through a cable.
In some cases it can be useful to change the name of an input pin or output pin before connecting to a cable without having to change the node itself. Therefore a tack can be given an alias which is the name that is 'visible' on the cable to determine which connections are being made. Double click the tack to input an alias.
Pads
Pads are used inside a group node and expose the pins of the group node. There are two ways to add a pad, either by adding a pin to the group node or by extruding a pin inside the group node view. To extrude a pin, shift-ctrl + left click on the pin and move the cursor.
Multiple inputs/outputs can be connected to a pad. Pads can also be connected to cables.
Using the Editor
Main menu
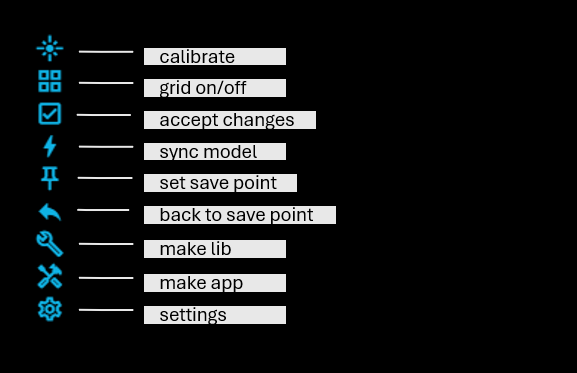
accept changes : when a linked node is modified in its original file, the model that imports the node will show what has changed - added, changed or deleted pins and interfaces. Additions will be shown in green, removed pins or connections in red. Click on this icon to accept these changes.
wire check : compares the current drawn routes with the connections from the current save point. Connections that still exist in the save point but are missing from the drawing are redrawn in green. Routes that are currently drawn but no longer match the save point connections are shown in red. Use accept changes to accept the proposed green routes and remove the red routes.
sync model : changes to external files, eg nodes with external links, will reflect immediately in the importing file. If the node linked to is however in the same file, it can be necessary to do a 'sync' to force an immediate update of the model.
set save point / back to save point: before a big modefication of a model it might be worth considering to set a save point, which saves the current status of the file. If the modefication did not turn out as expected, back to save point will reset the model to what was saved. The initial save point is set when the model is read from file.
make lib: outputs a file 'my-model-lib.js' that is the main file for building a bundle with the nodes of the model. Also the model is part of the bundle. Typically used to build a library of standard nodes.
make app: outputs the main file of the vmblu-based application. To be included in a browser page, run at the server etc. The file consists of a list of nodes and filters that are created by the runtime.
settings: the settings for the model.
Selections
The editor often works on selections: a node, a pin, a group of nodes etc.
Selecting in the editor is done by clicking on the node or pin to be selected. To select multiple nodes or pins in a rectangular area use [shift] + [left mouse button] + drag. A selection is shown in orange or with an orange box around it.
To reposition a pin in a node use [ctrl]+[left mouse button]+drag. You can also drag a group of selected pins like that. To drag all the pins of an interface, simply [ctrl]+[left mouse click]+drag the interface name.
Context Menus
The actions that are available for an item of the model can be selected from a context menu, that pops up when clicking the [right mouse button] on the item. For many of the actions listed in the menu there is akos a key combination available. The editor has the following context menus:
Background Menu
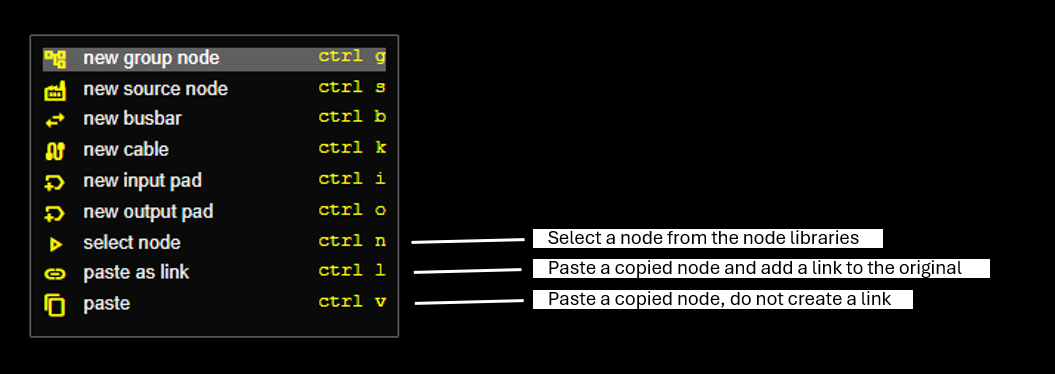
Node Menu
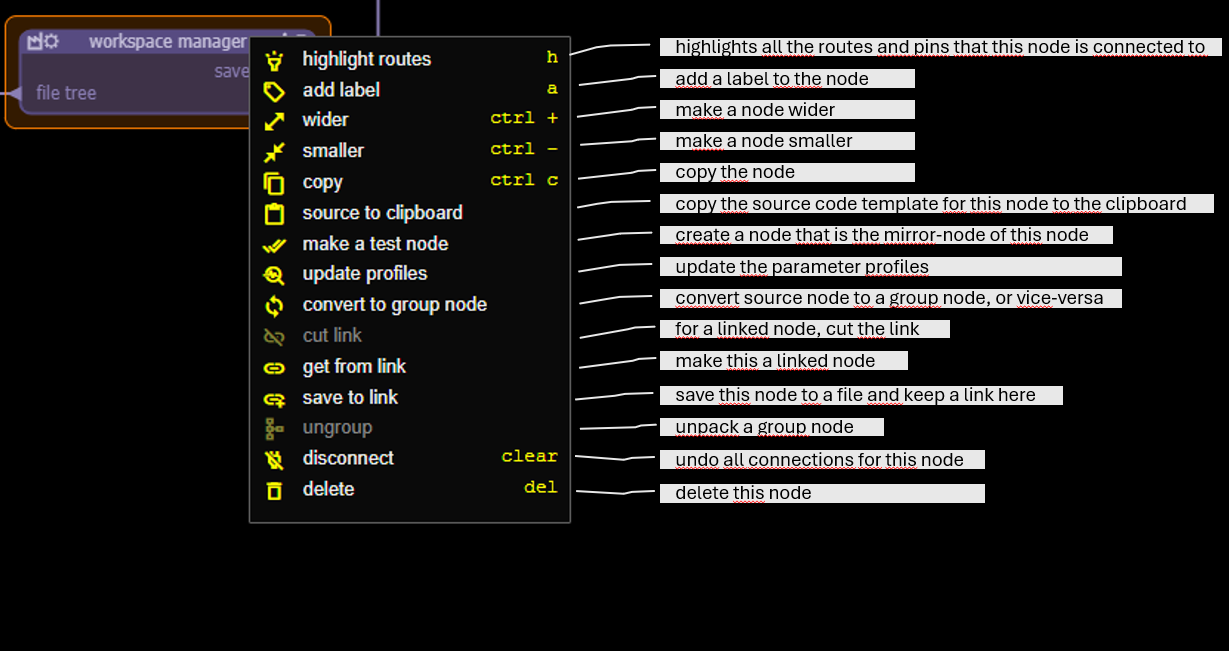
- source to slipboard: Puts an outline of the source code for this node on the clipboard. The outline contains the headers for the handlesr of the input pins of the node.
- make a test node: creates a node that is a mirror image of this node: for every input pin of the node the mirror node has an output pin, and for evey output pin the mirror node has an input pin. The mirror node is typically used to make a test node for the original node.
- update profiles: re-scan the source of the node to update what parameters are required by a message handler and where output messages are sent.
Pin Area Menu
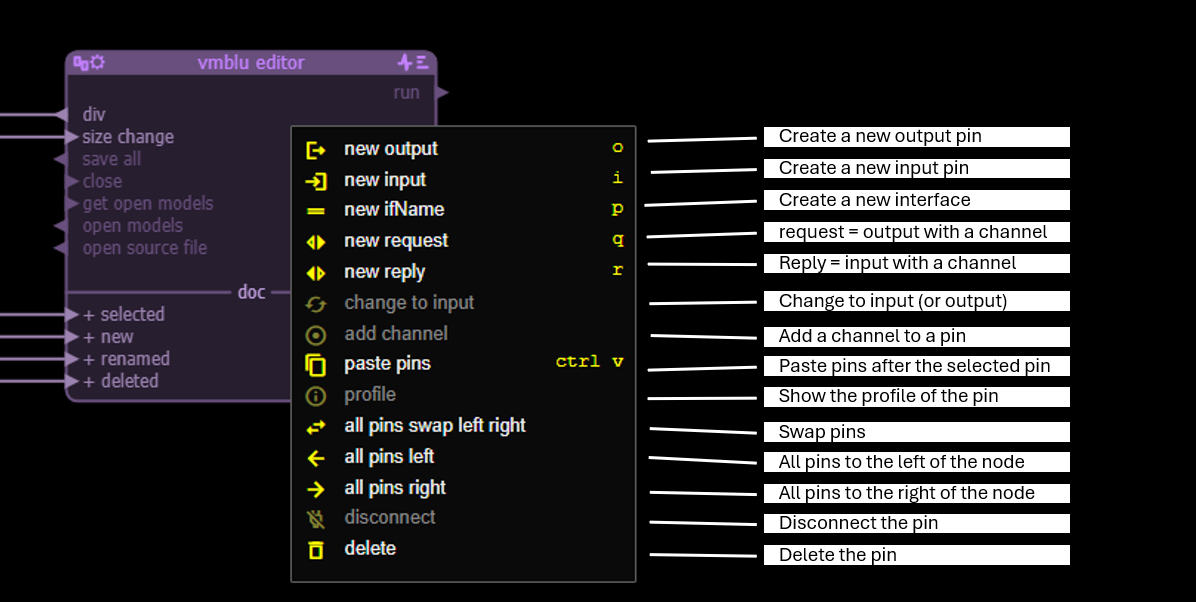
- add channel: makes a request pin from an output pin and a reply pin from an input pin.
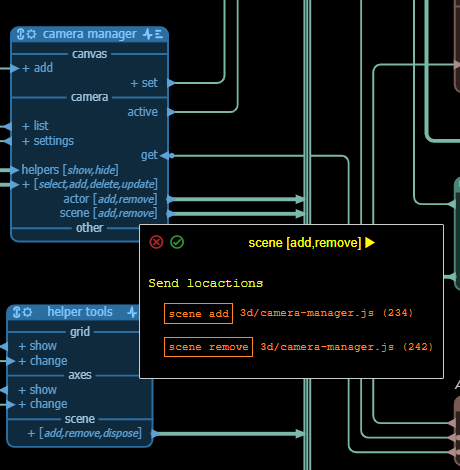
- profile: shows the profile of the pin. For an input or reply pin this shows the parameter signature of the handler for the message and the file where the handler can be found. When clicking on the file the file is opened at the position of the handler. For an output or request message this shows the location(s) in the source where the message is sent. Clicking on these opens the file at the location where the message is sent.
Input pin profile example:
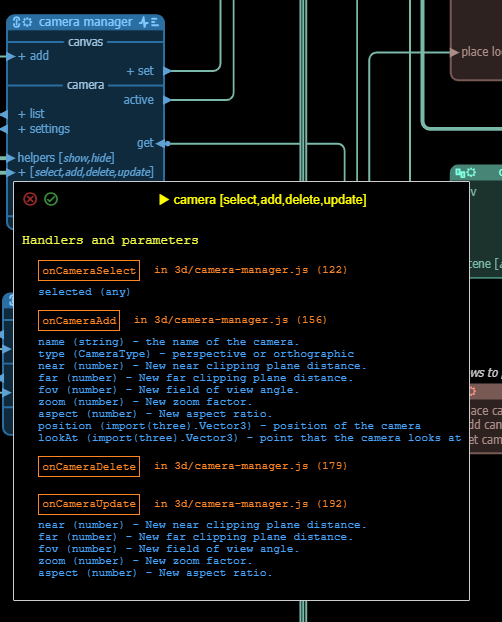
Output pin profile example:
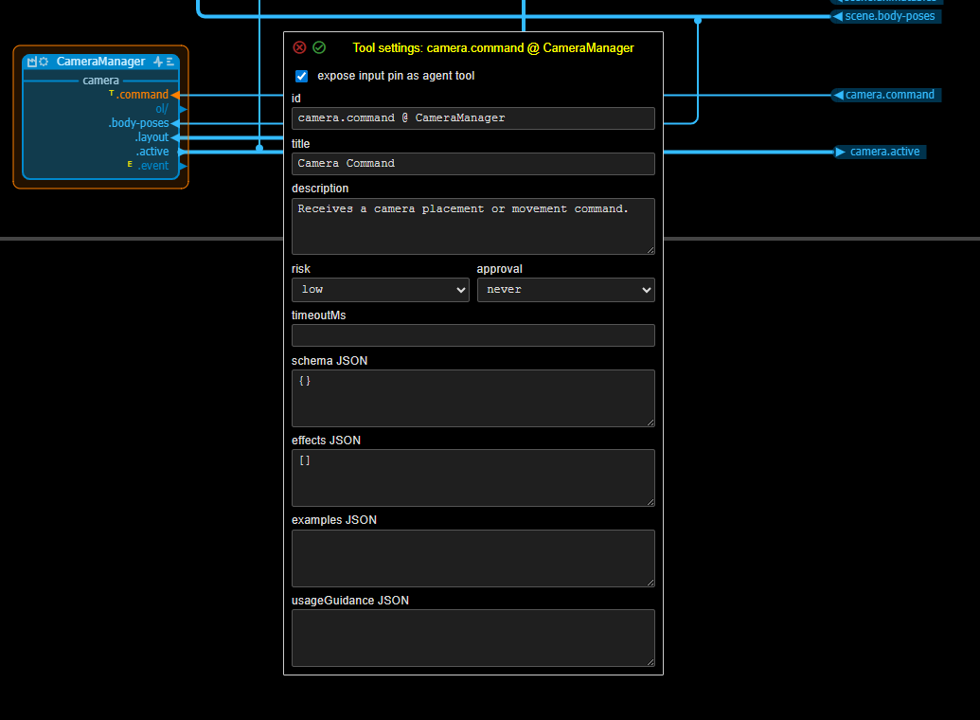
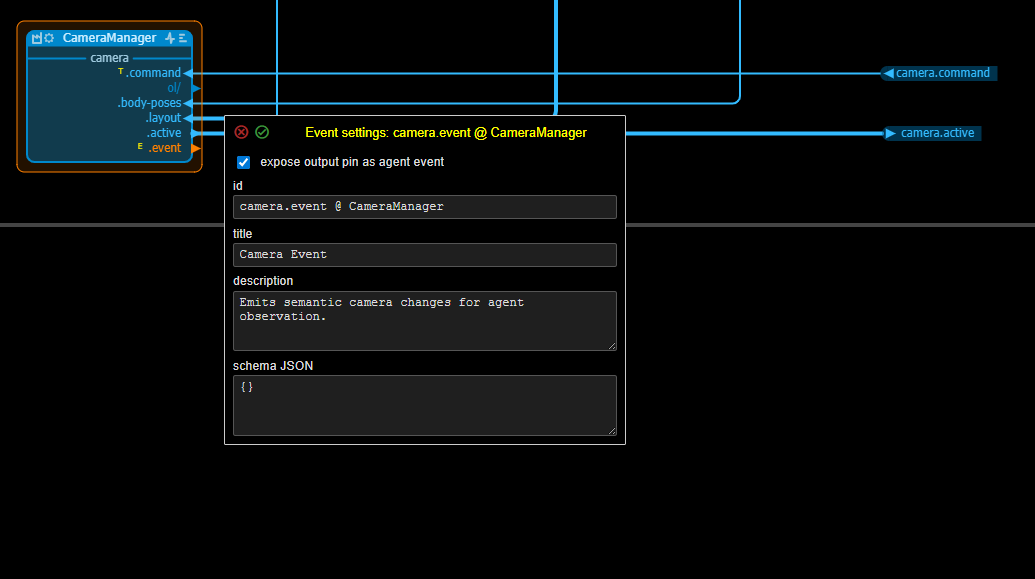
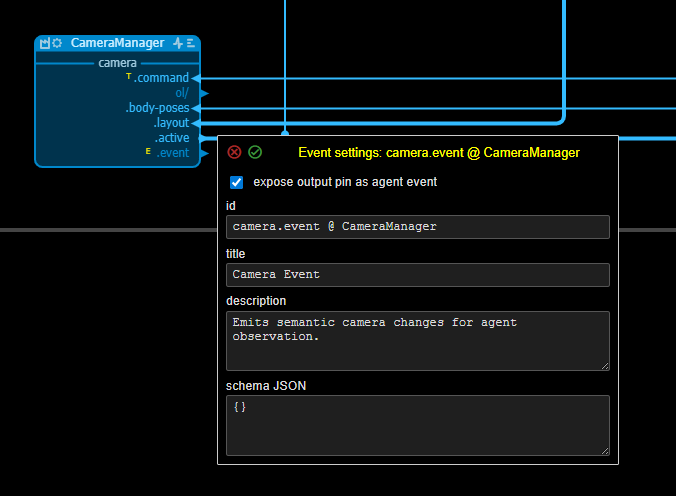
As is explained in the chapter on agent integration, input pins can be exposed as tools to be used by an agent and output pins can be marked as events to be signalled to an agent. When an input pin is marked as a tool, a small yellow T is shown in front of it, when an output pin is marked as an event a small yellow E is shown in front of it.
Input pin tool example:
Output pin event example:
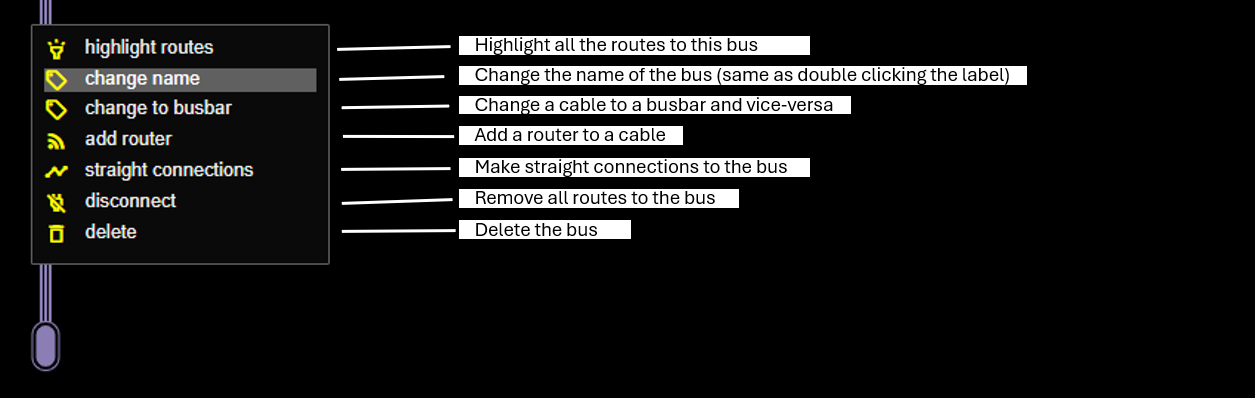
Cable Menu
Selection Menu
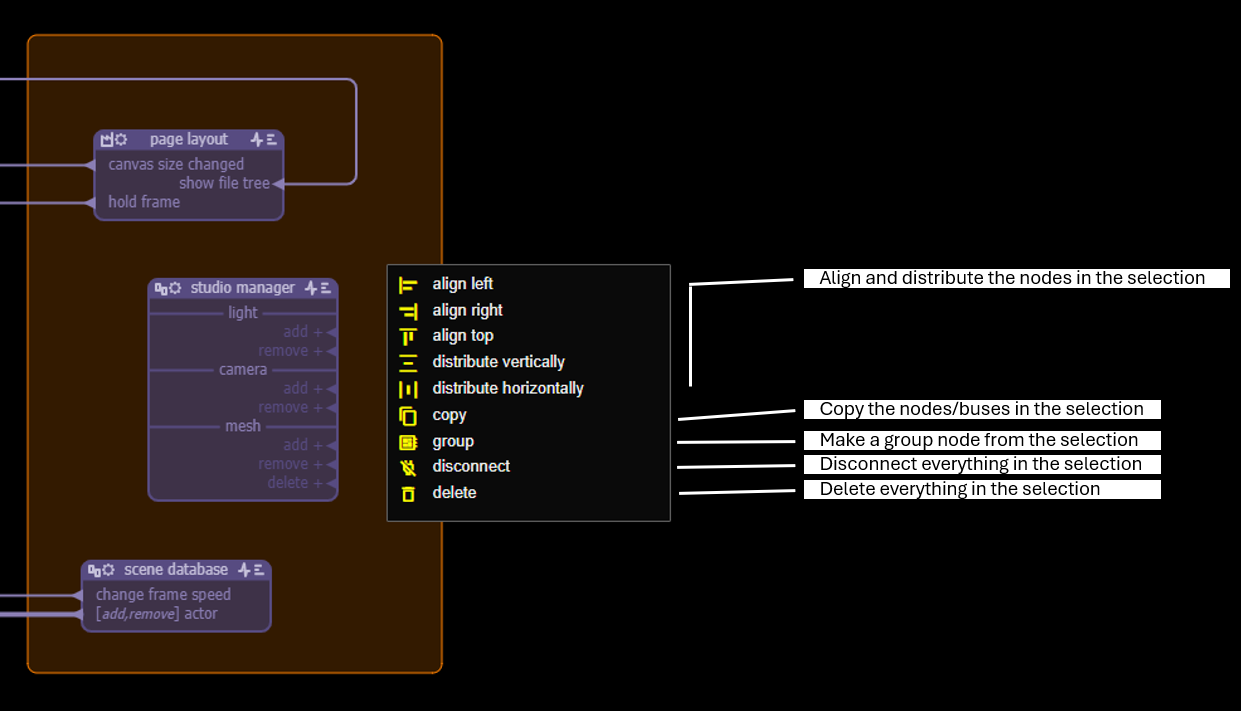
- group: allows to make a single group node from the selected nodes. External connections will stay intact. If needed, cables will be duplicated inside the group node. External pins will be given corresponding pads inside the group node.
Source Integration
Every source node has an implementation in code. In that code handlers correspond with input/reply messages and output/request messages are sent via the runtime.
Source nodes are instantiated at runtime by calling the factory function for that node. The factory function can either be a normal function that returns the node, or it can be a class name, in which case the runtime will instantiate with new mySourceNode.
When the factory function is called, two parameters are passed to it, tx and sx, and the function should return, explicitely or implicitely, a reference to an object that allows the runtime to parse for the message handlers. In most cases that object is simply the instance of the node, but it does not have to be.
Factory functions
Below are a few examples of factory functions:
A simple function that returns the node:
function mySourceNodeFactory(tx, sx) {
  // create the node here
  const mySourceNode = ...

  // explicitely return
  return mySourceNode;
}
A constructor function:
//Constructor for planet
export function CelestialOrb(tx, sx) {
  // save the tx and the sx
  this.tx = tx;
  this.sx = sx;

  // the planet specs
  this.ephemeris = null;

  // etc...

  // return is implicit
}
CelestialOrb.prototype = {
  // The message handlers - and other methods
  onSomeMessage(payload) {},

  onSomeOtherMessage(payload) {},
};
A class:
// Declaration
class DatabaseAccess {
  constructor(tx, sx) {
    // Save the transmitter
    this.tx = tx;

    // save the settings
    this.sx = sx;
  }
  // The message handlers - and other methods
  onSomeMessage(payload) {}

  onSomeOtherMessage(payload) {}
}
All nodes are created by the runtime before it starts to switch messages between them. This means that a node can already send messages as soon as it is created, the messages will be placed on the message queue, and do not have to worry about nodes not yet being created.
The sx parameter are the settings for the node as set via the settings icon of the node. The txparameter - the transmitter - is an object that gives the node access to the functions of the runtime library.
Below we have a look at how messages are mapped to handlers and to the tx interface.
Messages and handlers
When a node is instantiated, the runtime will scan the returned object for handlers that correspond to the input pins of the object.
A handler function is a normal function that is called by the runtime with the message payload as the only parameter and this set to the node for which the handler is called.
The correspondence is straightforward: with a message some message corresponds a handler with the name onSomeMessage, ie the message name is preceeded by 'on' and camel-cased.
Message names are allowed to contain special characters and spaces, but these special characters are stripped from the handler name. The editor signals when the handler name for two messages are the same, eg some message and some.message.
The tx interface
The transmitter txthat is passed as a parameter to the node exposes the interface with the runtime. It has the following members:
tx.send(pinName, payload)This function sends a message over pin pinName with one parameter, the payload. The payload can be anything, but will be an object in most of the cases. The function returns the number of messages that have been send, so if the pin is not connected it will return 0 (zero).tx.request(pinName, payload, { timeout? })This function also sends a payload over a pin pinName but has an additional, optional, timeout parameter. The request function returns a promise that resolves when the reply from the connected node(s) comes in. If a request is connected to three pins that can give a reply then three promises will be created. The promise is rejected immediately if no reply pins are connected to the request pin, and also when the timeout is triggered. The default value for the timeout is a setting for the runtime, but typically a few seconds.tx.reply(payload)A node can issue a reply on a reply pin, whereby the payload is returned over the same pin and resolves the outstanding promise at the requesting node.tx.next(partial)In stead of a reply, a node can also answer with next. This will return the payload to the requesting node but create a promise again to wait for the answer on this reply. In this way two nodes can have a conversation by using next in turns until it is terminated by the final replytx.reschedule()It some cases it can be that a node cannot handle a message because certain conditions have not yet been met. This situation can be solved in several ways, but for convenience a simple function has been added to the tx interface that simply puts the message on the message queue again so that it will be presented again at the next iteration.tx.pinthis property is the name of the pin from which the message originated that the handler is treating.tx.select(nodeName).sendandtx.select(nodeName).request(...)In a vmblu model a node does not have to know anything about the architecture of the total system to send and receive messages. Theselectfunction is an exception to that rule, in so far that it allows to select one particular node among all the nodes that are already connected to the pin. So if nodes A, B and C are connected to pin x of a node then you can select one of the nodes by usingtx.select('B').send(pin, payload). This is handy for example when many nodes are connected via a floating cable in a test setup.
JSDoc tags
JSDoc tags are used in the source code to make the pin profile information work. Under the hood vmblu uses ts-morph to scan the source files for parameter info. The parameter info can be taken from typescript type info or, for javascript, from the @param JSDoc tag.
vmblu uses two specific tags to locate information:
@node <node name>this tag indicates that the methods/functions in a file are for the node of that name, so that the handlers and thetx.sendcan be linked to that node. Placing it once at the start of a file is sufficient and it stays valid until the next@nodetag in the file.@prompt <text>LLM-friendly description of a handler.
Tool exposure is capability-based and should be defined in the model. The generated capability manifest can then be projected to MCP or provider-specific tool formats.
The coding agent will add coding tags as required.
Example of a decorated handler function:
/**
 * @prompt Notification that a document was renamed.
 * @node document manager
 * @param {Object} info
 * @param {string} info.oldName - Previous document name
 * @param {string} info.newName - New document name
 */
onDocRenamed({ oldName, newName }) { /* ... */ }
Making the app
As already explained, the coding agent uses a specific command to generate the app from a model file by using the vmblu make-appcommand.
The app can also be generated from within the editor: in the main menu select the rocket icon to generate the javascript code for the app.
The code generated contains three main sections:
- Import section: here all the files with the factory functions are imported. Example:
// ------------------------------------------------------------------
// Model:
// Path: solar-system-app.js
// Creation date 9/22/2025, 8:57:19 AM
// ------------------------------------------------------------------

// import the runtime library
import * as VMBLU from "@vizualmodel/vmblu-runtime/rt-base";

//Imports
import { ScreenLayout,
		 HelpersSettings,
		 SolarSystemSettings,
		 SimulationSettings,
		 CamerasSettings,
		 IconMenuHorizontal,
		 LLMChatWindow } from './ui/index.js'
// etc...
import { PlanetaryDistance } from './chart/index.js'- Nodes section: An array of source nodes and the connections to other source nodes. Example:
//The runtime nodes
const nodeList = [
	//_______________________________________________SCREEN LAYOUT
	{
	name: "screen layout",
	uid: "PzOB",
	factory: ScreenLayout,
	inputs: [
		"-> menu",
		"-> timeline",

    //etc...

		"-> right side toggle",
		"-> right side add div"
		],
	outputs: [
		"visible start -> update start @ renderer (imdr)",
		"visible stop -> update stop @ renderer (imdr)",
		"canvas -> canvas add @ camera manager (LDdW)"
		]
	},
	//________________________________________________HELPER TOOLS
	{
	name: "helper tools",
	uid: "whha",
	factory: HelperTools,
	inputs: [
		"-> grid change",
		"-> axes change"
		],
	outputs: [
		"grid show -> grid set @ helper settings (zBFx)",
		"axes show -> axes set @ helper settings (zBFx)",
		"scene add -> scene add @ scene manager (tKKg)",
		"scene remove -> scene remove @ scene manager (tKKg)",
		"scene dispose -> scene dispose @ scene manager (tKKg)"
		],
	sx:	{
		    "grid": {
          "on": false,
          "color": "0x773333"
		    },
		    "axes": {
		        "on": false,
		        "size": "50"
		    }
		}
	},
Also the optional sx, the parameters for the node, and dx, the parameters for the runtime, are included for each node.
- Runtime section: Here the function
scaffoldis called. scaffold instantiates all the nodes and returns a reference to the runtime. Finally the runtime is started.
// prepare the runtime
const runtime = VMBLU.scaffold(nodeList, filterList)

// and start the app
runtime.start()
Running an app
A vmblu app can be run like any other js or ts app, for example run inside a browser
<!doctype html>
<html lang="en">
  <head>
    <meta charset="UTF-8" />
    <meta name="viewport" content="width=device-width, initial-scale=1.0" />
    <title>Vmblu Browser Version</title>
    <link rel="stylesheet" href="index.css">
  </head>
  <body>
    <script type="module" src="vmblu.js"></script>
  </body>
</html>
Or run as a node.js app
node myVmbluApp.jsConsole warnings
The scaffold function can issue the following warnings:
** NO HANDLERS **The node has input pins but the factory returned no handlers.** NO HANDLER **The node has an input pin for which there is no handler.** NO OUTPUT PIN **tx.send()is used but there is no corresponding output pin.
The app does continue, it could simply be that some functionality has not yet been implemented.
Testing with vmblu
There is a special prompt for a coding agent to generate a test environment for a vmblu application.
It instructs the coding agent to run the command vmblu make-test. This command creates a test/ folder and a test model. The test model can use mirror nodes when internal message flow needs to be observed. A mirror node has the same pins as the original node, but with the direction swapped: input becomes output, output becomes input.
The mirror node also has additional connections that are connected via a floating cable to the sequencer node. The sequencer node is the node that orchestrates the execution of the tests to be done on the source nodes.
Tests setups can require more complex configurations and these can of course be added to the test setup as required. As the original nodes are imported via links, the test model remains always in sync with the original model.
The coding agent will write the code for the mirror nodes and place it in the mirrors/ folder.
Running the tests generates a report and the coding agent will use the output of that report to correct/improve the code of the original node.
Generated tests
The testing approach is moving toward a larger automatically generated baseline. The capability metadata already describes what an application exposes:
- tools are actions that can be called;
- probes are read-only checks of current state;
- events are observations emitted by the application;
- effects describe what a tool is expected to change.
This gives vmblu enough information to generate useful first tests without trying every possible input combination. The generated tests should start with:
- one smoke test for each tool that has an example or clear schema;
- one read test for each probe;
- one observation test for each meaningful event;
- effect tests where a tool names the probes or events that verify success;
- security tests for nodes or tools that touch file, network or process capabilities.

Mirror nodes remain useful, but they should not be generated for every wire by default. Prefer probes for current state, events for semantic observations and security events for runtime policy breaches. Use mirror nodes when the test needs to inspect internal message flow that is not otherwise exposed.
Authored tests
Generated tests are the baseline. Important workflows can still be written as authored scenarios. These scenarios call tools, wait for events, read probes and assert the resulting state. This keeps testing close to the same controlled surface that agents use at runtime.
The vmblu Runtime
The vmblu runtime serves three main functions:
- message switching between nodes
- giving agents controlled access to a vmblu app
- reporting and enforcing runtime security policy
Actually there are several runtimes in the vmblu distribution, and the appropriate runtime is normally selected based on the requirements of the app. Because the runtime is also open source, projects can add or remove functionality from it as they see fit. The runtime is a fairly small piece of code, and your coding agent will quickly understand what it does and how it works.
Let's have a look now at the three main functions of the runtime.
Message switching
The vmblu runtime is the execution layer for a generated application. It instantiates all nodes, resolves the connections between their pins, and then switches messages between them according to the model. In a generated app the runtime is created by calling scaffold(nodeList, filterList), after which runtime.start() starts the message flow. Because the application is generated from the model, the runtime can keep the logical architecture and the executing code aligned very closely.
Every application of a certain complexity and size will have somewhere in its code a loop of some kind that looks for work to do. In a vmblu application that is taken care of by the message loop. It is a very efficient message switch and has a clever implementation for the request-reply type of messages that can be used between nodes.
Security enforcement
Besides message switching, vmblu also supports runtimes with safety instrumentation. The safety-enabled runtime attributes certain privileged operations to the node that triggered them, even across asynchronous execution. At the moment it observes process execution, network egress and file-system writes or deletes, and emits structured security.event messages containing a timestamp, the node name, the capability involved, the effective policy decision and additional detail. This is intended as a runtime observability and policy-checking layer: it makes dangerous behaviour visible and reportable.
The current security runtime is report-first. It records that a security breach or policy violation occurred; concrete reactions such as blocking, approval prompts or test failures can be attached to that event path later. The model-level runtime settings define the maximum security envelope for the application. A node can request stricter or more specific settings, but it cannot broaden what the model-level policy allows.

Agent access
Applications today must offer a structured interface to agents so that the agents can use the application efficiently as a tool. The nodes and messages based structure of a vmblu applications lend it very well to be used as a tool set for an agent: an agent can inject messages at the node's input pins and wait for the results at its output pins. A typical application for this type of access is to let the user type requests in plain language and have an LLM-based agent translate these into messages to be injected into the application.
The advantage of scenarios like these is, first of all, that an agent can be given fine-grained access to an application and second, that the agents actions follow the same flow as messages that originate from more traditional user interactions via the ui of the application.
However this poses the question of how you control and limit what an agent can do with the application. And that is where the runtime comes in as it is via the runtime that the agent is given access to the application. In this way 'capabilities' for an agent can be defined what a particular agent is allowed and not allowed, to do.
Also important is that, because the agent access flows via the runtime, a developer does not have to design his own particular access methods between the agent and the application.
The details of this are discussed in the chapter of Agent Integration
Selecting a runtime
The vmblu distribution comes with three runtimes that can be selected:
- rt-base
- rt-als
- rt-agent
The runtime used by an application is selected in the header of the model. By default vmblu uses @vizualmodel/vmblu-runtime/rt-base, which is the normal runtime without safety instrumentation. If you want privileged operations to be attributed and reported, you can select @vizualmodel/vmblu-runtime/rt-als instead. The third runtime, rt-agent, includes the same safety foundation and adds the capability mechanism for controlled agent access to an application.
Runtimes are expected to follow the rt-* naming convention. Built-in runtimes are shipped by the vmblu runtime package, but future projects can provide their own runtime variants when they need a different deployment, security, testing or agent integration model.
Runtime settings
Runtime settings exist at two levels.
At the model level, simple settings can live in the model header next to the selected runtime as header.runtimeSettings. Larger runtime configurations can live in a sidecar file named <model-name>.rt.json, referenced from the header as a path. These model-level settings define the application-wide security envelope and runtime defaults.
In the editor, these model-level settings are reached from the model settings popup. The runtime field selects the runtime package, and the settings button opens the runtime settings JSON editor. When no settings exist yet, the editor starts from the selected runtime's default structure. The saved value can be inline JSON settings or a sidecar reference such as { "path": "./my-application.rt.json" }.
At the node level, each node can carry runtime settings in its dx object. These settings are intended for the runtime rather than for the node itself. The dx object is organized into three sections:
run: where and how the node runs, for example worker placement.monitor: runtime observability, for example message logging and timings.security: node-specific security requests.
Node security settings are off by default. A node must explicitly opt into custom security settings, and even then those settings are judged against the model-level envelope. If a node requests something outside that envelope, the runtime should report a security policy violation rather than silently allowing it.
The node runtime settings popup shows a warning when a node request is outside the model envelope. The saved node settings are still stored as requested, but the runtime clips the effective policy to the model-level maximum.
In the current safety-enabled runtime, security.mode can be off, warn, or enforce; warn reports dangerous behaviour, while enforce uses the same instrumentation path but is meant for deterministic violation reporting rather than hard blocking. If security.forward is enabled, the resulting safety events are forwarded into the vmblu graph as security.event, so they can be picked up by monitoring or test nodes.
The policy decision is included on the event as policy.decision. For example, an observed file write under a model policy where file access is deny is reported with policy.domain set to fs, policy.permission set to deny, and policy.decision set to denied.
Example inline runtime settings:
{
  "header": {
    "runtime": "@vizualmodel/vmblu-runtime/rt-als",
    "runtimeSettings": {
      "security": {
        "mode": "warn",
        "forwardEvents": true,
        "defaults": {
          "fs": "warn",
          "net": "deny",
          "process": "deny"
        },
        "allow": {
          "netHosts": ["localhost"],
          "fsRoots": ["./data"]
        }
      }
    }
  }
}
Example sidecar reference:
{
  "header": {
    "runtime": "@vizualmodel/vmblu-runtime/rt-als",
    "runtimeSettings": {
      "path": "./my-application.rt.json"
    }
  }
}
Security enforcement
The problem
Security enforcement addresses a practical risk of agent-assisted application development. A coding agent can write useful application code, but it can also produce behavior that is broader than intended: writing files, deleting files, calling the network or starting child processes.
Static analysis and tests are useful, but they are not enough. vmblu also needs runtime enforcement: when the application runs, the runtime should know which node caused a sensitive operation, whether that operation is inside the application security policy and whether the operation is allowed, reported or blocked.
This chapter is about runtime behavior. It is not a replacement for normal application security, dependency review or vulnerability management. It is a way to control and inspect sensitive behavior performed by nodes in a vmblu application.
Security areas
vmblu security settings are organized by area. The first areas are:
- File system: reading, writing and deleting files.
- Network: outgoing network connections.
- Process: starting external processes.
The area structure is deliberate. It keeps the model understandable now and leaves room to add more areas later without changing the basic security model.
Each area contains concrete operations. For example:
fs.read
fs.write
fs.delete
net.egress
process.exec
Each operation has a mode:
allow
warn
deny
The mode is attached to the operation itself. There is no separate global "warn mode" for the whole security system.
The meaning is:
allow: the operation is expected if it matches any configured limits.warn: the operation is permitted, but a security event is emitted.deny: the operation is outside policy and must be blocked or treated as a policy violation.
warn and deny operations produce security events. How those events are shown to the user is a UI decision, not part of the security policy itself.
Model security envelope
Security is set at the model level first. The model-level security settings define the maximum envelope for the whole application.
For example:
{
  "security": {
    "fs": {
      "read": {
        "mode": "deny",
        "roots": []
      },
      "write": {
        "mode": "warn",
        "roots": ["./out"]
      },
      "delete": {
        "mode": "deny",
        "roots": []
      }
    },
    "net": {
      "egress": {
        "mode": "warn",
        "hosts": ["api.example.com"]
      }
    },
    "process": {
      "exec": {
        "mode": "deny",
        "commands": []
      }
    }
  }
}
This example says:
- nodes may not read files by default;
- nodes may write files under
./out, but each write is reported; - nodes may not delete files;
- nodes may connect to
api.example.com, but each connection is reported; - nodes may not start external processes.
For simple applications, model-level security settings can live in the model header. For larger applications, they can move to a sidecar file named <model-name>.rt.json.
Relative paths in security settings are resolved relative to the application project folder: the folder that contains the vmblu model entry point. For example, if the model is stored at apps/reporting/reporting.mod.blu, then ./out means apps/reporting/out. This keeps security settings stable when the application is started from a different working directory.
Node security requests
Node-level security settings are more restrictive by default. A node starts with everything denied. It only receives access when the application developer explicitly changes that node's runtime security settings.
This is important:
model security = maximum application envelope
node security  = explicit request inside that envelope
A node cannot grant itself more permission than the model allows. It can only request access inside the model envelope.
For example, a node that exports images might request:
{
  "security": {
    "fs": {
      "write": {
        "mode": "warn",
        "roots": ["./out/images"]
      }
    }
  }
}
If the model envelope allows writes under ./out, this node request is valid because ./out/images is inside the model boundary. If the model envelope denies file writes, the request is rejected or clipped to deny.
Effective policy
The runtime calculates the effective policy from the model envelope and the node request. The result is always the stricter policy.
Examples:
- model says
fs.write.mode = deny, node requestsallow: effective result isdeny; - model says
fs.write.mode = warn, node requestsallow: effective result iswarn; - model says
fs.write.mode = allow, node requestswarn: effective result iswarn; - model allows
./out, node requests./out/images: effective roots are./out/images; - model allows
./out, node requests./private: effective result is outside the envelope and must be denied.
When the model security envelope is tightened, vmblu should check node security settings against the new boundary. Any node request that crosses the boundary must be visible to the developer so the node settings can be updated deliberately.
Imported nodes
Security settings are application decisions, not reusable node-library decisions.
When a node is imported from another file, its security settings are not imported as permissions for the current application. The current application must grant runtime security access explicitly.
This prevents a reusable node from carrying broad permissions into another application without review.
Node settings in the model
Because the node default is deny-all, a node with no saved security settings should be understood as:
this node has no sensitive runtime permissionsWhen a node does have security settings, those settings are explicit grants requested by this application. That makes sensitive nodes easier to review.
Runtime security events
Safety-enabled runtimes observe sensitive operations and emit a security.event message when an operation is warned or denied.
The event should include:
- the node that caused the operation;
- the concrete operation, such as
fs.writeornet.egress; - operation details, such as path, URL, command or host;
- the effective policy decision;
- the reason when the operation is outside a configured boundary.
A typical event:
{
  "node": "ImageExporter",
  "operation": "fs.write",
  "detail": {
    "path": "./out/images/result.png"
  },
  "policy": {
    "decision": "warning",
    "area": "fs",
    "action": "write",
    "mode": "warn"
  }
}
An event outside the configured file roots might look like:
{
  "node": "ImageExporter",
  "operation": "fs.write",
  "detail": {
    "path": "./private/result.png"
  },
  "policy": {
    "decision": "denied",
    "area": "fs",
    "action": "write",
    "mode": "deny",
    "reason": "fs_root_not_allowed"
  }
}
The runtime uses asynchronous execution context to keep track of the active node, even when the node performs asynchronous work before touching the file system, network or process APIs. This lets a security event be attributed to the node that caused it.
Enforcement and scope
The security policy controls behavior that vmblu can observe through its runtime. The intended behavior is:
allowoperations proceed without a security event unless another boundary is crossed;warnoperations proceed and emit a security event;denyoperations emit a security event and are blocked by the vmblu runtime.
This is different from an operating-system sandbox. vmblu controls and attributes sensitive operations made through the runtime process. That is a strong application-level boundary, but it is not the same as isolating the process from the machine.
The distinction matters:
- vmblu can block a node from writing outside an allowed directory when that write goes through file-system APIs observed by the runtime.
- vmblu can block a node from making network requests when the node has no
net.egresspermission. - vmblu can attribute those operations to the active node, even when the operation is performed by code called from that node.
- vmblu cannot protect a secret that has already been given to the process. If an API key is available in the process environment, deployment controls must decide whether that process is allowed to have it.
- vmblu cannot remove vulnerabilities from third-party libraries. If a node imports a vulnerable library, the vulnerability is still present in the code running inside the process.
Third-party libraries are still subject to the vmblu runtime boundary when they perform observed sensitive operations on behalf of a node. For example, if a node calls an imported library and that library tries to send data to the network, the operation is evaluated as net.egress for that node. If the effective node policy denies network egress, the operation is blocked. If the policy warns, the operation proceeds but produces a security event. The same principle applies to observed file-system and process operations.
This means vmblu security is useful even when application code uses external packages: it can restrict and attribute sensitive behavior caused by those packages during node execution. It should still be combined with the normal security controls around the runtime process:
- Dependency review: review third-party packages before using them, remove unnecessary dependencies and watch for known vulnerabilities. vmblu can block observed network, file-system or process behavior from a package, but it does not prove that the package is otherwise correct or safe.
- OS permissions: run the application process with only the operating-system permissions it needs. If the process user can read a private file or access a secret, vmblu should not be the only layer preventing misuse.
- Container or process isolation: use containers, separate users or other isolation mechanisms when an application should not be able to access parts of the host system at all. vmblu controls behavior inside the runtime process; isolation controls what the process can reach outside itself.
- Browser sandboxing: browser applications still rely on the browser's own sandbox, origin rules and backend boundaries. Do not put provider API keys or machine-local secrets in browser code.
- Secret management: give the process only the secrets it needs, and prefer short-lived or scoped credentials. vmblu can restrict where a node sends data, but it cannot make an over-broad secret safe once that secret is available to the process.
- Deployment controls: production systems should still use logging, monitoring, environment separation and release review. vmblu security events become much more useful when they are connected to those operational controls.
Those layers protect the process, its environment and its supply chain. vmblu protects the application-level runtime boundary inside the process.
Agent integration
Agents, AI nodes and capabilities
vmblu distinguishes between AI nodes and external agents.
An AI node is part of the application graph. It performs a defined task inside the application, such as summarization, classification, extraction, translation or generation, and communicates with other nodes through normal vmblu pins.
An agent is different. An agent is normally external to the application. It does not become a node in the application graph and it does not call application code directly. It interacts with the application only through capabilities exposed by the vmblu ToolBroker.
This distinction is important. vmblu is not an agent framework. It does not prescribe how an agent plans, reasons, remembers context or coordinates multi-step work. Instead, vmblu provides the controlled application boundary that agents and agent frameworks can use.
A vmblu application can expose three kinds of agent-facing capabilities:
- Tools: controlled actions that an agent can request. In vmblu, tools normally correspond to selected node input pins.
- Events: meaningful notifications that an agent can observe. In vmblu, events normally correspond to selected node output pins.
- Probes: read-only state queries implemented by source nodes. Probes let an agent inspect selected internal state without direct access to node internals.
Tool and event pins have settings:
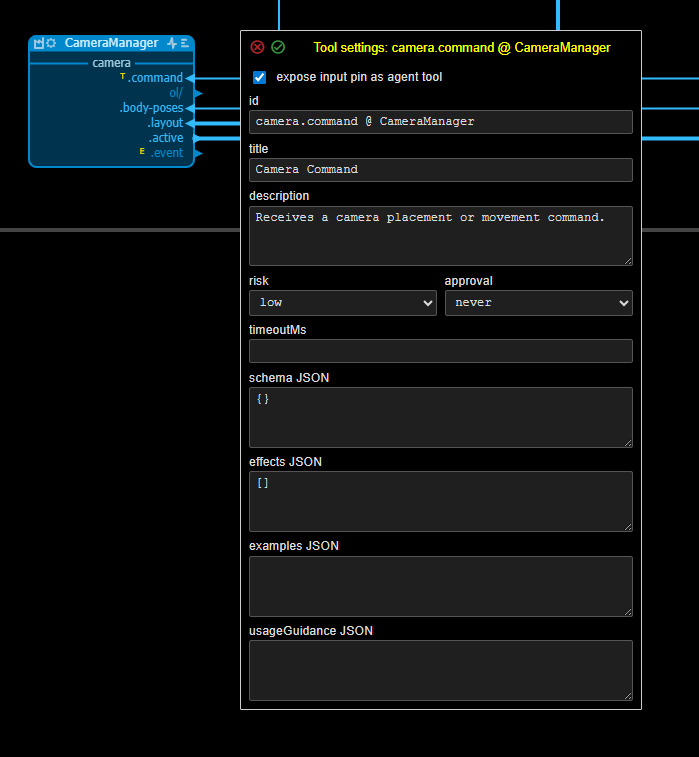
The developer decides which pins and probes are exposed. From that information vmblu generates a capability manifest:
vmblu make-capabilities <project-name>.bluThe generated capability file is vmblu-native. It describes the application's agent-facing surface: what an agent may call, observe or inspect, and which policies apply.
MCP, OpenAI tool schemas, Claude tool schemas and other provider-specific formats are projections of this capability model. They are adapter formats, not the source of truth. The vmblu model remains the authoritative description of the application architecture and its controlled agent interface.
In normal use, the application developer does not have to hand-write all of this metadata. A human can explicitly mark an input pin as a tool or add a probe, but the intended workflow is usually more direct: tell the coding agent what an external agent should be able to do through the application's capability surface.
For example:
Let the external agent move the camera to a planet and then verify which body the
camera is following.
The coding agent can then inspect the model, find the relevant command pin, mark it as a tool, add or update the tool schema, add a probe if state needs to be verified, implement the node's probe(name, args) method if needed, and regenerate the capability manifest. The human still reviews the model and code, but the coding agent does most of the mechanical wiring.
The ToolBroker
When an agent calls a tool, it should not directly call arbitrary application code. In vmblu, every agent action is routed through the ToolBroker and then through the normal vmblu runtime message queue.
The conceptual path is:
agent
  -> provider tool call or MCP tool call
  -> capability/tool adapter
  -> ToolBroker
  -> vmblu runtime queue
  -> target node input pin
  -> result, event or probe response
This keeps agent actions inside the same message-passing architecture as the rest of the application. A tool call becomes a controlled message to a known node and pin, with a declared schema and policy.
The ToolBroker is the enforcement boundary for agent access. It validates arguments, applies approval rules, limits access to declared capabilities, normalizes results, reports errors and records trace information. When used with an instrumented runtime, broker activity can also be linked to runtime security events, making it possible to attribute, report or block dangerous actions.
The provider protocol can change without changing the internal application architecture. MCP, OpenAI tools, Claude tools or other adapters can all map to the same vmblu capability model.
The runtime agent UI
One common use of an external agent is as a natural language user interface to the application. That use case is provided by the optional llm-overlay runtime library and is normally used through the rt-browser-agent runtime.
In the current browser implementation the UI mode is an overlay. The generated application mounts a small floating launcher button, normally in the bottom right of the application. Clicking it opens a movable and resizable agent window with a chat tab and a trace tab.
The overlay belongs to the AgentRuntime, not to the ToolBroker. That split is deliberate:
AgentRuntimeowns chat, provider communication and the overlay UI.ToolBrokerowns capability access, dispatch, event observation and trace records.- The application graph remains unaware of the overlay unless a future in-app UI mode explicitly routes agent I/O through app pins.
The browser overlay flow is:
user
  -> overlay chat
  -> AgentRuntime
  -> LLM provider adapter
  -> tool/probe call
  -> ToolBroker
  -> vmblu runtime queue
  -> app node
  -> result, trace, probe value or observed event
The trace tab is useful while developing an agent-capable application. It shows broker activity such as tool calls, probe reads and observed events. This makes it much easier to see whether an agent request reached the app and whether the app exposed the capability the user expected.
Runtime support
Agent-facing applications normally use one of the explicit runtime imports:
@vizualmodel/vmblu-runtime/rt-base
@vizualmodel/vmblu-runtime/rt-browser-agent
@vizualmodel/vmblu-runtime/rt-als
@vizualmodel/vmblu-runtime/rt-nodejs-agent
rt-base is the normal message-switching runtime. rt-browser-agent adds agent-facing support for browser applications, including the ToolBroker, capability registration, probe reads, event capture, trace recording and the optional overlay. rt-als adds attribution and safety instrumentation for Node.js applications. rt-nodejs-agent combines the agent layer with the Node.js safety runtime.
The old @vizualmodel/vmblu-runtime/rt-agent import is kept as a compatibility alias for rt-nodejs-agent. New models should choose the more explicit rt-browser-agent or rt-nodejs-agent runtime.
The implementation is split into reusable runtime libraries:
agent-base: common agent runtime support, ToolBroker, capability registry, policy and trace recording.agent-adapters: target-specific capability projections and provider or gateway adapters.llm-overlay: the optional browser chat and trace overlay.security: Node.js safety and attribution support used by ALS-based runtimes.
These libraries do not make the external agent part of the application graph. They add controlled agent-facing support around the existing application.
The runtime is selected in the model header. Generated apps import the selected runtime explicitly. The package root @vizualmodel/vmblu-runtime should not be used as a runtime import.
For a simple agent-facing browser app, the model header normally contains both the runtime selection and an agent block:
{
  "header": {
    "runtime": "@vizualmodel/vmblu-runtime/rt-browser-agent",
    "agent": {
      "schema": "https://vmblu.dev/schemas/agents.v1.json",
      "version": 1,
      "defaultAgent": "operator",
      "agents": [
        {
          "id": "operator",
          "type": "overlay",
          "enabled": true,
          "title": "Agent Interface",
          "instructions": "Help the user operate the application through published vmblu capabilities.",
          "llm": {
            "provider": "openai",
            "model": "gpt-4.1-mini",
            "endpoint": "http://127.0.0.1:8080/v1"
          },
          "ui": {
            "mode": "overlay"
          },
          "permissions": {
            "tools": {
              "allow": ["camera_control"],
              "deny": []
            },
            "probes": {
              "allow": ["camera.active"],
              "deny": []
            },
            "events": {
              "allow": ["camera.changed"],
              "deny": []
            }
          }
        }
      ]
    }
  }
}
The llm.endpoint should point to a trusted bridge or application backend. Do not put provider API keys in the model or in browser code.
For larger applications, agent configuration can move to a sidecar file named <model-name>.agent.json. The header can then keep only the runtime selection and a reference to the agent configuration. The header form is convenient for simple applications; the sidecar form is better when permissions, provider settings, UI settings or future multi-agent setup become too large for the model header.
Agent Settings
The editor includes an Agent Settings popup for defining the agent-facing interfaces of an application. This is application configuration, not the agent implementation itself. It tells vmblu which interfaces exist, which capability ids each interface may use and which runtime or server details are needed for that interface.
The popup can define one or more agent interfaces. Each interface has:
- identity fields:
id,title,enabledand the default agent selection, - a
type, currently includingoverlay,http,mcp,openai,claudeandlangchain, - instructions for the agent,
- provider fields for overlay or OpenAI-style use, such as provider, model and endpoint,
- server fields for HTTP interfaces, such as host, port and base path,
- transport fields for MCP-style interfaces,
- permissions that select the allowed tools, probes and events from the generated capability manifest.
The overlay type is the current browser chat window use case. The http and openai targets can already be projected by the adapter command described below. MCP, Claude and LangChain use the same configuration model, but their specific adapters can be added incrementally without changing the vmblu capability model.
Setting up an agent-enabled app
The practical setup is:
- Select
@vizualmodel/vmblu-runtime/rt-browser-agentfor a browser app with the overlay, or@vizualmodel/vmblu-runtime/rt-nodejs-agentfor a Node.js app that needs agent support plus safety attribution. - Open Agent Settings and define the application interface: agent id, type, title, instructions, provider or server settings and the allowed capability ids.
- Store the agent configuration in
header.agent, or point the header to a<model-name>.agent.jsonsidecar when the configuration is larger. - Decide what the external agent should be able to do, or ask the coding agent to add a specific agent-facing capability.
- Mark selected input pins as tools with a
toolblock. This can be done directly in the editor or by asking the coding agent to expose the relevant command as a tool. - Mark source-node state checks as probes with node-level
probesmetadata. The coding agent should add probes when it needs a reliable way to verify state after a tool call. - Implement
probe(name, args)on source nodes that expose probes. In most projects this code is written or updated by the coding agent together with the node implementation. - Mark meaningful output pins as events with an
eventblock. - Run
vmblu make-capabilities <project-name>.blu. - Run
vmblu make-app <project-name>.blu. - For a browser overlay, start the LLM bridge or application backend configured in the selected agent's
llm.endpoint. - Run the app and use the floating agent button, or connect the external agent through the configured server or adapter.
For an agent runtime app, the generated app should construct the runtime with an options object:
import {Runtime} from '@vizualmodel/vmblu-runtime/rt-browser-agent'
import capabilities from './solar-system.cap.json' with { type: 'json' }
import agent from './solar-system.agent.json' with { type: 'json' }

const runtimeOptions = {
  capabilities,
  agent
}

const runtime = new Runtime(nodeList, runtimeOptions)
runtime.start()
That options object contains the generated capability manifest and the agent configuration. Without capabilities, the broker has no tools, probes or events to expose. Without agent, the runtime has no selected agent interface to start.
Tools, probes and events
Tools are for controlled changes to application state. They are normally declared on input pins. A user can mark an input pin as a tool manually, but it is often better to describe the desired external-agent action and let the coding agent choose the right pin and schema.
Probes are read-only state checks. They are declared on source nodes and implemented by a method named probe(name, args). Probes are useful because they let the agent verify what happened after a tool call without giving the agent direct access to internal node data. A coding agent should add or extend probes when it needs reliable evidence that an action had the intended effect.
Events are observations emitted by output pins. They should represent meaningful occurrences, not every state update. If an output pin fires every frame or every simulation tick, expose a separate semantic event pin instead. For example, a renderer may need a continuous camera.active state stream, while the agent should observe a lower-frequency camera.changed event.
This means the agent-facing surface evolves with the application. When the external agent cannot satisfy a user request because no suitable tool, probe or event exists, that is useful design feedback. The next coding-agent task can be to add the missing capability to the model, update the relevant node code and regenerate the app.
Agent adapter projections
External agents normally need two things: a server or gateway they can talk to, and a capability description in the format expected by that agent or SDK. vmblu keeps the capability manifest as the source of truth and projects it into target-specific formats.
Use make-agent-adapter to generate a projection from the model capability surface and the selected agent configuration:
vmblu make-agent-adapter <project-name>.blu --target openai --agent operator --out ./agent.openai.json
vmblu make-agent-adapter <project-name>.blu --target http --agent operator --out ./agent.http.json
The command reads the model, the generated or computed capabilities and the selected agent interface. It then uses the same agent-adapters runtime library that application servers can use directly. This keeps CLI output and runtime behavior aligned.
Current adapter targets include:
vmblu: the native capability view,openai: an OpenAI-tool-compatible projection,http: a simple HTTP gateway projection.
Future MCP, Claude and LangChain adapters should be built on the same projection model. A Node.js application can generate these views on startup or on request from the in-memory capability manifest. The CLI remains useful for inspection, build artifacts and SDKs that expect a static file.
MCP as an adapter
MCP remains useful, but it should be understood as an adapter layer. MCP defines how tools are presented to an MCP-compatible client and how tool calls are sent back. In vmblu, the tool list should come from the model's capability metadata, and tool calls should still enter the application through the ToolBroker and runtime.
A typical MCP-facing setup is:
vmblu model
  -> capability manifest
  -> MCP tool projection generated by an adapter
  -> MCP server or adapter
  -> MCP client / agent
The current direction is capability-based: mark capabilities in the model and generate the relevant agent-facing surfaces from the model. MCP should still route tool calls through the ToolBroker, just like OpenAI, HTTP or any other provider-specific interface.
Browser apps and the LLM bridge
When a vmblu application runs in the browser during local development, a direct browser connection to an LLM provider is usually the wrong architecture. Provider API keys should not live in frontend code or browser storage, and many providers block browser requests from local development origins through CORS.
The local LLM bridge solves this by placing a small trusted local server between the browser and the provider. It can live under:
.vmblu/llm-bridge/The browser talks to a local URL such as http://127.0.0.1:8080/v1; the bridge adds the provider API key server-side and forwards only allowed API paths to the upstream provider. For local development, the API key should live in a machine-local environment file such as .env.local, not in application code.
In production, this local bridge should usually be replaced by the application's normal backend or API layer. The pattern remains the same: browser code talks to a trusted server controlled by the application, not directly to the LLM provider.
FAQ
- Does vmblu use standard -closed- nodes ? No in vmblu the function of a node - the source code of the node - is provided by the developer of the system and there are no 'closed' nodes in vmblu, there is no lock-in. Obviously vmblu is ideal to design a library of standard nodes for all kinds of tasks that can then easily be used across multiple project, but that is entirely up to the dev team.
- Can the vmblu runtime be modified ? Yes, the runtime is part of the vmblu distro and is also open source. It is short and sweet and if for some reason you want to modify it, you can.
- TS or JS? Both. TS types are read; in JS, add JSDoc for types.
- Is vmblu available for other languages For the moment vmblu is only available for TS/JS. In principle there is no limitation with respect to the languages the vmblu model can be applied to. As demand grows, runtimes for other languages will be added.
- Type safety between pins? Each pin has a contract: the format of the data it needs to see when sending or receiving a message. A pin can either 'own' the contract or 'follow' the contract.
- When to use request/reply? In most cases request/reply will be used sparingly between nodes. If you see that you have to use it a lot , there is probably a better split possible of functionalities between nodes.
- Can I reuse nodes? Yes: make a linked node or bundle; accept changes to stay in sync.
Glossary
- Node — source, group, or linked component.
- Pin — input/output connection point.
- Interface — group of pins with shared prefix/suffix.
- Route — connection between pins.
- Cable — shared routing trunk. Floating cables have free handles; fixed cables attach to pins or pads at both ends.
- Cable tack — connection point between a route and a cable. A tack can be selective or non-selective.
- Selective tack — cable tack that only connects matching pin names or its explicit alias.
- Non-selective tack — cable tack that connects without name matching, subject to normal input/output rules.
- Pad — group node IO exposed internally.
- Profile — pin metadata linking to source code sites.
- sx/dx — node vs runtime settings.
- MCP — Model Context Protocol for tool integration.
Appendices
Keyboard Shortcuts
| Action | Shortcut |
|---|---|
| Add input pin | I |
| Add output pin | O |
| Add request pin | Q |
| Add reply pin | R |
| Add interface name | F |
| Show selected pin profile | P |
| Show selected pin capability | E or T |
| Add or edit node label | A |
| Highlight selected node routes | H |
| Edit selected widget text | Enter or + |
| Clear selected widget text | - |
| Select previous or next widget | Arrow Up / Arrow Down |
| Clear selection | Escape |
| Disconnect selected node or selection | Clear |
| Delete selected node, pin, interface or selection | Delete |
| Create source node | Ctrl + S |
| Create group node | Ctrl + G |
| Create floating cable | Ctrl + B |
| Create input pad | Ctrl + I |
| Create output pad | Ctrl + O |
| Copy selection | Ctrl + C |
| Paste | Ctrl + V |
| Paste as link | Ctrl + L |
| Make selected node wider | Ctrl + + |
| Make selected node narrower | Ctrl + - |
| Undo | Ctrl + Z |
| Redo | Ctrl + Shift + Z |
| Pan view | Drag empty background |
| Multi-select nodes | Shift + drag empty background |
| Select pins in a node area | Shift + drag on a node, pin or interface |
| Move pin or interface | Ctrl + drag pin or interface |
| Extend node selection | Ctrl + click node |
| Draw route | Drag from a pin or pad arrow |
| Reroute from route segment or cable tack | Shift + drag route segment or tack |
| Convert route segment to fixed cable | Ctrl + drag route segment |
| Start route from cable segment | Ctrl + drag cable segment |
| Extrude pin to group pad | Ctrl + Shift + drag pin |
| Create floating cable at cursor | Ctrl + Shift + click empty background |
| Edit text label, pad or cable tack alias | Double click |
| Open context menu | Right click |